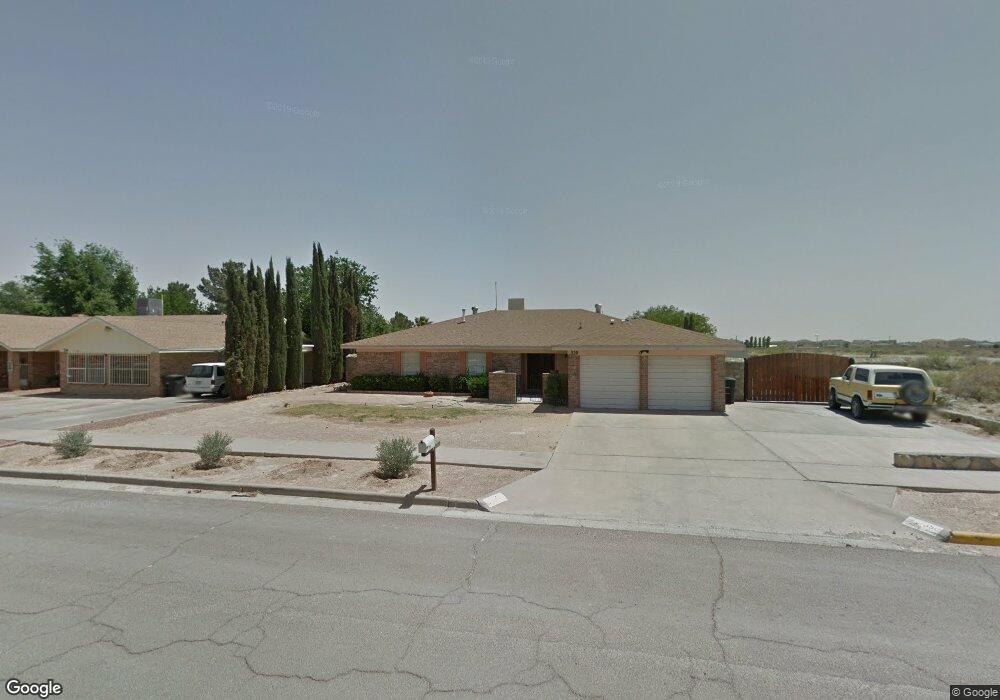
350 Cross River Rd Horizon City, TX 79928
Estimated Value: $258,000 - $282,000
4
Beds
2
Baths
2,054
Sq Ft
$131/Sq Ft
Est. Value
About This Home
This home is located at 350 Cross River Rd, Horizon City, TX 79928 and is currently estimated at $269,406, approximately $131 per square foot. 350 Cross River Rd is a home located in El Paso County with nearby schools including Horizon Heights Elementary School, Col. John O. Ensor Middle School, and Eastlake High School.
Ownership History
Date
Name
Owned For
Owner Type
Purchase Details
Closed on
Jun 18, 2015
Sold by
Bolaski Brenda S and Mendoza Debra B
Bought by
Bolaski Robert P
Current Estimated Value
Purchase Details
Closed on
Nov 12, 2003
Sold by
Jp Morgan Chase Bank
Bought by
Bolaski Brenda Sue
Home Financials for this Owner
Home Financials are based on the most recent Mortgage that was taken out on this home.
Original Mortgage
$83,686
Interest Rate
5.84%
Mortgage Type
FHA
Purchase Details
Closed on
Sep 2, 2003
Sold by
Herrera Fernando and Herrera Alicia
Bought by
Mlmi Mortgage Loan Asset Backed Certific
Purchase Details
Closed on
Jul 1, 1998
Sold by
Montoya Albert and Montoya Alicia
Bought by
Herrera Fernando and Herrera Alicia
Home Financials for this Owner
Home Financials are based on the most recent Mortgage that was taken out on this home.
Original Mortgage
$82,800
Interest Rate
9.96%
Create a Home Valuation Report for This Property
The Home Valuation Report is an in-depth analysis detailing your home's value as well as a comparison with similar homes in the area
Home Values in the Area
Average Home Value in this Area
Purchase History
| Date | Buyer | Sale Price | Title Company |
|---|---|---|---|
| Bolaski Robert P | -- | None Available | |
| Bolaski Brenda Sue | -- | -- | |
| Mlmi Mortgage Loan Asset Backed Certific | $93,500 | -- | |
| Herrera Fernando | -- | -- |
Source: Public Records
Mortgage History
| Date | Status | Borrower | Loan Amount |
|---|---|---|---|
| Previous Owner | Bolaski Brenda Sue | $83,686 | |
| Previous Owner | Herrera Fernando | $82,800 |
Source: Public Records
Tax History Compared to Growth
Tax History
| Year | Tax Paid | Tax Assessment Tax Assessment Total Assessment is a certain percentage of the fair market value that is determined by local assessors to be the total taxable value of land and additions on the property. | Land | Improvement |
|---|---|---|---|---|
| 2025 | $4,507 | $248,694 | $18,158 | $230,536 |
| 2024 | $4,507 | $220,362 | -- | -- |
| 2023 | $4,032 | $200,329 | $0 | $0 |
| 2022 | $5,772 | $182,117 | $0 | $0 |
| 2021 | $5,823 | $167,120 | $18,158 | $148,962 |
| 2020 | $5,324 | $150,510 | $18,158 | $132,352 |
| 2018 | $4,258 | $132,056 | $18,158 | $113,898 |
| 2017 | $4,153 | $130,237 | $18,158 | $112,079 |
| 2016 | $4,687 | $146,984 | $18,158 | $128,826 |
| 2015 | $4,335 | $146,984 | $18,158 | $128,826 |
| 2014 | $4,335 | $146,779 | $18,158 | $128,621 |
Source: Public Records
Map
Nearby Homes
- 369 Cross River Rd
- 390 Medill Place
- PN-31080 Tbd
- PN-129994 Darrington
- 394 Brill Cir
- 0 Highweed Dr Unit 918787
- 400 Mura Place
- 0 Fallon Rd Unit 928403
- TBD Rodman St
- 16020 Homestead Dr
- TBD Tbd
- 14032 Highweed Dr
- 13860 Summer View Ave
- 13829 Summer View Ave
- 13915 Sky Harbor Ave
- 409 Desert Chicory St
- 441 Desert Dandelion St
- 14937 Roslyn Dr
- 14052 Highweed Dr
- 317 Jim Knowles Place
- 354 Cross River Rd
- 366 Brill Cir
- 364 Brill Cir
- 351 Cross River Rd
- 358 Cross River Rd
- 355 Cross River Rd
- 368 Brill Cir
- 362 Brill Cir
- 359 Cross River Rd
- 364 Cross River Rd
- 352 Higley Cir
- 370 Brill Cir
- 356 Higley Cir
- 360 Brill Cir
- 365 Cross River Rd
- 363 Brill Cir
- 360 Higley Cir
- 372 Brill Cir Unit 1
- 368 Cross River Rd
- 348 Higley Cir