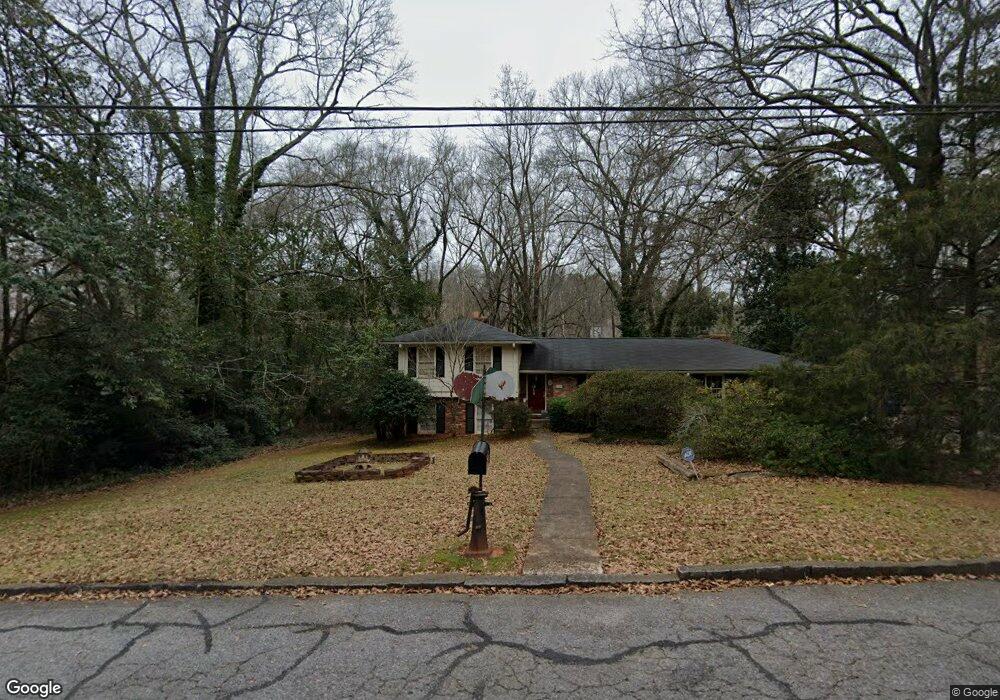
350 Duncan Springs Rd Athens, GA 30606
Five Points NeighborhoodEstimated Value: $565,398 - $760,000
--
Bed
--
Bath
2,847
Sq Ft
$244/Sq Ft
Est. Value
About This Home
This home is located at 350 Duncan Springs Rd, Athens, GA 30606 and is currently estimated at $695,350, approximately $244 per square foot. 350 Duncan Springs Rd is a home located in Clarke County with nearby schools including Barrow Elementary School, Clarke Middle School, and Clarke Central High School.
Create a Home Valuation Report for This Property
The Home Valuation Report is an in-depth analysis detailing your home's value as well as a comparison with similar homes in the area
Home Values in the Area
Average Home Value in this Area
Tax History Compared to Growth
Tax History
| Year | Tax Paid | Tax Assessment Tax Assessment Total Assessment is a certain percentage of the fair market value that is determined by local assessors to be the total taxable value of land and additions on the property. | Land | Improvement |
|---|---|---|---|---|
| 2025 | $1,284 | $244,464 | $60,000 | $184,464 |
| 2024 | $1,284 | $226,614 | $60,000 | $166,614 |
| 2023 | $987 | $207,277 | $50,000 | $157,277 |
| 2022 | $1,088 | $184,817 | $50,000 | $134,817 |
| 2021 | $771 | $157,209 | $40,000 | $117,209 |
| 2020 | $851 | $143,800 | $40,000 | $103,800 |
| 2019 | $964 | $139,451 | $40,000 | $99,451 |
| 2018 | $876 | $122,056 | $40,000 | $82,056 |
| 2017 | $918 | $115,895 | $40,000 | $75,895 |
| 2016 | $962 | $110,458 | $40,000 | $70,458 |
| 2015 | $933 | $100,297 | $36,000 | $64,297 |
| 2014 | $2,939 | $96,298 | $32,000 | $64,298 |
Source: Public Records
Map
Nearby Homes
- 262 Rhodes Dr
- 299 Kennington Dr
- 105 Princeton Mill Rd
- 213 Highpointe Ln
- 185 Eaglewood Way
- 253 Sleepy Creek Dr
- 277 Highpointe Ln
- 104 W Lake Ct
- 2019 S Lumpkin St
- 275 Westview Dr
- 145 Holmes Ave
- 780 Macon Hwy
- 164 Plum Nelly Rd
- 275 Davis Estates Rd
- 145 Heatherwood Ln
- 190 Bowles Dr Unit 1
- 190 Bowles Dr
- 589 W Lake Dr
- 105 Greystone Terrace
- 340 Duncan Springs Rd
- 360 Duncan Springs Rd
- 345 Duncan Springs Rd
- 330 Duncan Springs Rd
- 335 Duncan Springs Rd
- 195 Maple Cir
- 370 Duncan Springs Rd
- 150 Maple Ln
- 175 Maple Cir
- 375 Duncan Springs Rd
- 130 Maple Ln
- 195 Maple Ln
- 390 Duncan Springs Rd
- 315 Duncan Springs Rd
- 320 Duncan Springs Rd
- 0 Maple Ln Unit CM344014
- 120 Maple Ln
- 140 Oakdale Rd
- 155 Maple Cir
- 120 Holmes Ct