Estimated Value: $485,000 - $500,617
Studio
--
Bath
2,910
Sq Ft
$169/Sq Ft
Est. Value
About This Home
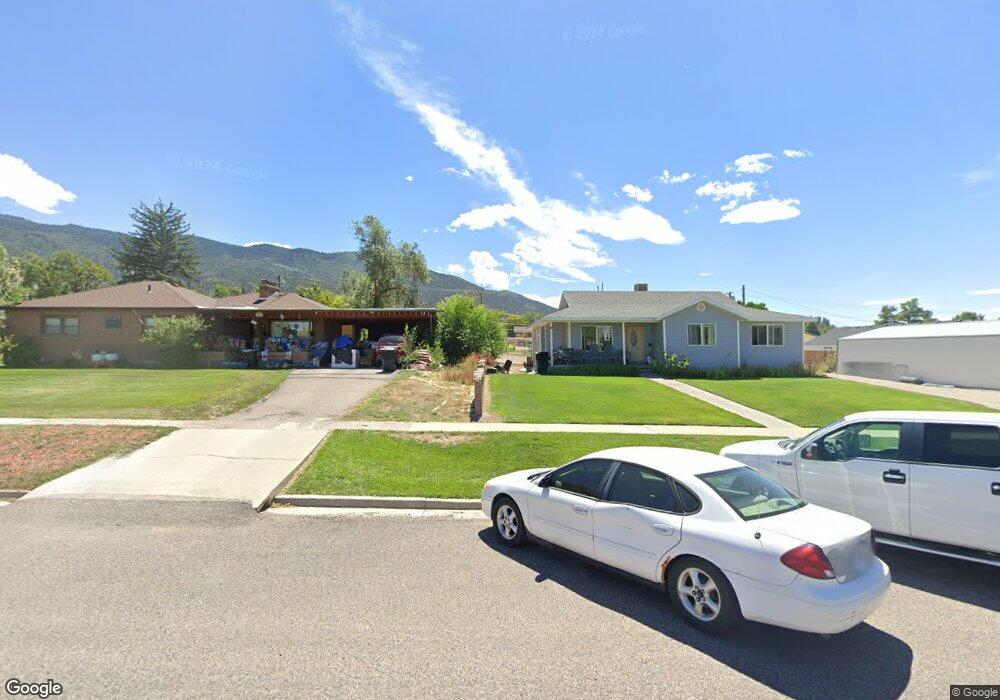
This home is located at 350 E Union St, Manti, UT 84642 and is currently estimated at $491,154, approximately $168 per square foot. 350 E Union St is a home located in Sanpete County.
Ownership History
Date
Name
Owned For
Owner Type
Purchase Details
Closed on
Aug 29, 2025
Sold by
Larson Angela L
Bought by
Riggins Donald
Current Estimated Value
Home Financials for this Owner
Home Financials are based on the most recent Mortgage that was taken out on this home.
Original Mortgage
$466,396
Outstanding Balance
$462,873
Interest Rate
0.65%
Mortgage Type
Construction
Estimated Equity
$28,281
Purchase Details
Closed on
Jul 20, 2010
Sold by
Degooyer Jack and Degooyer Mary Lou
Bought by
Larson Angela Lynn
Purchase Details
Closed on
Aug 20, 2009
Sold by
Degooyer Ned
Bought by
Degooyer Jack and Degooyer Mary Lou
Create a Home Valuation Report for This Property
The Home Valuation Report is an in-depth analysis detailing your home's value as well as a comparison with similar homes in the area
Home Values in the Area
Average Home Value in this Area
Purchase History
| Date | Buyer | Sale Price | Title Company |
|---|---|---|---|
| Riggins Donald | $471,060 | Meridian Title | |
| Larson Angela Lynn | -- | -- | |
| Degooyer Jack | -- | -- |
Source: Public Records
Mortgage History
| Date | Status | Borrower | Loan Amount |
|---|---|---|---|
| Open | Riggins Donald | $466,396 |
Source: Public Records
Tax History
| Year | Tax Paid | Tax Assessment Tax Assessment Total Assessment is a certain percentage of the fair market value that is determined by local assessors to be the total taxable value of land and additions on the property. | Land | Improvement |
|---|---|---|---|---|
| 2025 | $2,381 | $240,299 | $0 | $0 |
| 2024 | $1,193 | $229,245 | $0 | $0 |
| 2023 | $2,374 | $215,254 | $0 | $0 |
| 2022 | $2,279 | $188,334 | $0 | $0 |
| 2021 | $2,148 | $153,712 | $0 | $0 |
| 2020 | $2,000 | $134,572 | $0 | $0 |
| 2019 | $1,891 | $125,011 | $0 | $0 |
| 2018 | $1,701 | $197,646 | $31,482 | $166,164 |
| 2017 | $1,504 | $101,159 | $0 | $0 |
| 2016 | $1,421 | $95,593 | $0 | $0 |
| 2015 | $1,427 | $95,593 | $0 | $0 |
| 2014 | $1,399 | $95,593 | $0 | $0 |
| 2013 | $1,392 | $95,710 | $0 | $0 |
Source: Public Records
Map
Nearby Homes
Your Personal Tour Guide
Ask me questions while you tour the home.