350 E Wilson Bridge Rd Worthington, OH 43085
Estimated Value: $3,002,611
--
Bed
--
Bath
42,266
Sq Ft
$71/Sq Ft
Est. Value
About This Home
This home is located at 350 E Wilson Bridge Rd, Worthington, OH 43085 and is currently estimated at $3,002,611, approximately $71 per square foot. 350 E Wilson Bridge Rd is a home located in Franklin County with nearby schools including Wilson Hill Elementary School, Worthingway Middle School, and Thomas Worthington High School.
Ownership History
Date
Name
Owned For
Owner Type
Purchase Details
Closed on
Oct 22, 2015
Sold by
Association For The Developementally Dis
Bought by
Medvet Associates Llc
Current Estimated Value
Purchase Details
Closed on
Feb 28, 2011
Sold by
Cott Systemes Inc
Bought by
Association For The Developmentally Disa
Home Financials for this Owner
Home Financials are based on the most recent Mortgage that was taken out on this home.
Original Mortgage
$2,560,000
Interest Rate
4.76%
Mortgage Type
Future Advance Clause Open End Mortgage
Purchase Details
Closed on
Aug 21, 1998
Sold by
New Par and Dba Airtouch Cellular
Bought by
Cott Systems Inc
Purchase Details
Closed on
Jan 16, 1990
Create a Home Valuation Report for This Property
The Home Valuation Report is an in-depth analysis detailing your home's value as well as a comparison with similar homes in the area
Home Values in the Area
Average Home Value in this Area
Purchase History
| Date | Buyer | Sale Price | Title Company |
|---|---|---|---|
| Medvet Associates Llc | $1,550,000 | None Available | |
| Medvet Associates Llc | $1,550,000 | Attorney | |
| Association For The Developmentally Disa | $2,700,000 | None Available | |
| Cott Systems Inc | $32,000 | Hummel Title Agency Inc | |
| -- | $4,445,900 | -- |
Source: Public Records
Mortgage History
| Date | Status | Borrower | Loan Amount |
|---|---|---|---|
| Previous Owner | Association For The Developmentally Disa | $2,560,000 |
Source: Public Records
Tax History Compared to Growth
Tax History
| Year | Tax Paid | Tax Assessment Tax Assessment Total Assessment is a certain percentage of the fair market value that is determined by local assessors to be the total taxable value of land and additions on the property. | Land | Improvement |
|---|---|---|---|---|
| 2024 | $84,727 | $872,630 | $292,990 | $579,640 |
| 2023 | $80,816 | $872,620 | $292,985 | $579,635 |
| 2022 | $65,048 | $596,720 | $354,480 | $242,240 |
| 2021 | $61,431 | $596,720 | $354,480 | $242,240 |
| 2020 | $59,602 | $596,720 | $354,480 | $242,240 |
| 2019 | $57,219 | $542,500 | $322,280 | $220,220 |
| 2018 | $55,983 | $542,500 | $322,280 | $220,220 |
| 2017 | $75,147 | $542,500 | $322,280 | $220,220 |
| 2016 | $97,189 | $945,000 | $322,280 | $622,720 |
| 2015 | -- | $945,000 | $322,280 | $622,720 |
| 2014 | $47,524 | $945,000 | $322,280 | $622,720 |
| 2013 | $47,524 | $945,000 | $322,280 | $622,720 |
Source: Public Records
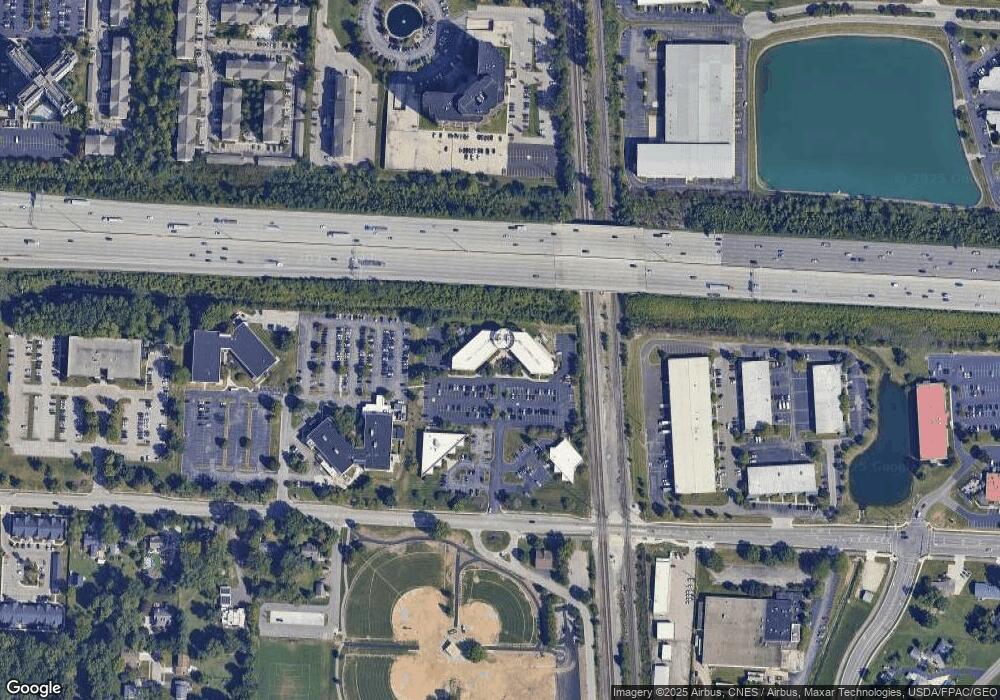
Map
Nearby Homes
- 6750 Worthington Galena Rd
- 694 Keys View Ct Unit 78
- 0 Pocono Rd Unit 225030021
- 940 Larkfield Dr
- 906 Linkfield Dr
- 6610 Worthington Galena Rd
- 7649 Flynnway Dr Unit 139
- 994 Annagladys Dr Unit M4
- 203 Saint Pierre St
- 7803 Barkwood Dr Unit 11C
- 210 Saint Antoine St Unit 25D
- 7685 Whitneyway Dr Unit 17
- 7817 Barkwood Dr Unit 12B
- 7736 Garrison Dr Unit 242
- 7949 Flint Rd
- 874 Sheldrake Ct Unit 21C
- 1158 Worthington Woods Blvd
- 7889 Woodhouse Ln Unit 44B
- 64 Glen Dr
- 902 Upholland Ln Unit 17A
- 400 E Wilson Bridge Rd
- 445 Hutchinson Ave Unit 195
- 445 Hutchinson Ave
- 250 E Wilson Bridge Rd
- 0 E Wilson Bridge Rd Unit L 17 9704355
- 0 E Wilson Bridge Rd
- 535 Lakeview Plaza Blvd
- 261 E Wilson Bridge Rd
- 247 E Wilson Bridge Rd
- 235 E Wilson Bridge Rd
- 227 E Wilson Bridge Rd
- 363 Grenadine Way
- 369 Grenadine Way
- 7300 Huntington Park Dr
- 217 E Wilson Bridge Rd
- 351 Peat Moss Dr
- 351 Peat Moss Dr
- 207 E Wilson Bridge Rd
- 421 E Wilson Bridge Rd
- 530 Lakeview Plaza Blvd Unit C