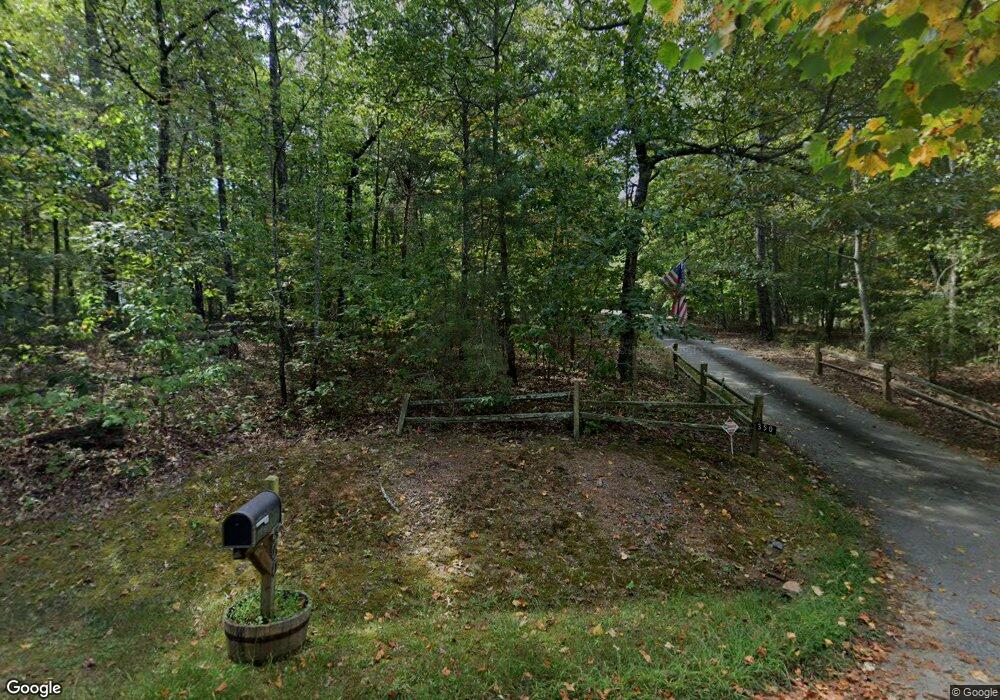
350 Eagles Nest Dr Unit 6 Clarkesville, GA 30523
Estimated Value: $291,133 - $364,000
3
Beds
2
Baths
1,435
Sq Ft
$223/Sq Ft
Est. Value
About This Home
This home is located at 350 Eagles Nest Dr Unit 6, Clarkesville, GA 30523 and is currently estimated at $319,533, approximately $222 per square foot. 350 Eagles Nest Dr Unit 6 is a home located in Habersham County with nearby schools including Fairview Elementary School, North Habersham Middle School, and Habersham Success Academy.
Ownership History
Date
Name
Owned For
Owner Type
Purchase Details
Closed on
May 2, 2025
Sold by
Henderson Arnold Cara
Bought by
Henderson Arnold Cara and Locke Arnold Julian
Current Estimated Value
Purchase Details
Closed on
Oct 30, 2015
Sold by
Henderson Mike
Bought by
Arnold Cara Henderson
Home Financials for this Owner
Home Financials are based on the most recent Mortgage that was taken out on this home.
Original Mortgage
$107,200
Interest Rate
3.89%
Mortgage Type
New Conventional
Purchase Details
Closed on
Oct 3, 2014
Sold by
Williams Kimberly Ann
Bought by
Henderson Mike and Henderson Cara
Home Financials for this Owner
Home Financials are based on the most recent Mortgage that was taken out on this home.
Original Mortgage
$103,000
Interest Rate
4.17%
Mortgage Type
New Conventional
Create a Home Valuation Report for This Property
The Home Valuation Report is an in-depth analysis detailing your home's value as well as a comparison with similar homes in the area
Home Values in the Area
Average Home Value in this Area
Purchase History
| Date | Buyer | Sale Price | Title Company |
|---|---|---|---|
| Henderson Arnold Cara | -- | -- | |
| Arnold Cara Henderson | -- | -- | |
| Henderson Mike | $123,000 | -- |
Source: Public Records
Mortgage History
| Date | Status | Borrower | Loan Amount |
|---|---|---|---|
| Previous Owner | Arnold Cara Henderson | $107,200 | |
| Previous Owner | Henderson Mike | $103,000 |
Source: Public Records
Tax History Compared to Growth
Tax History
| Year | Tax Paid | Tax Assessment Tax Assessment Total Assessment is a certain percentage of the fair market value that is determined by local assessors to be the total taxable value of land and additions on the property. | Land | Improvement |
|---|---|---|---|---|
| 2025 | $1,594 | $93,646 | $12,000 | $81,646 |
| 2024 | -- | $89,108 | $10,000 | $79,108 |
| 2023 | $1,015 | $75,296 | $10,000 | $65,296 |
| 2022 | $1,400 | $65,912 | $10,000 | $55,912 |
| 2021 | $1,295 | $57,084 | $7,200 | $49,884 |
| 2020 | $1,244 | $49,984 | $7,200 | $42,784 |
| 2019 | $1,245 | $49,984 | $7,200 | $42,784 |
| 2018 | $1,237 | $49,984 | $7,200 | $42,784 |
| 2017 | $1,184 | $46,020 | $7,200 | $38,820 |
| 2016 | $1,148 | $115,050 | $7,200 | $38,820 |
| 2015 | $1,134 | $115,050 | $7,200 | $38,820 |
| 2014 | $1,125 | $112,140 | $7,200 | $37,656 |
| 2013 | -- | $44,856 | $7,200 | $37,656 |
Source: Public Records
Map
Nearby Homes
- 4855 Georgia 115
- 0 Highway 115 Unit 10603845
- 350 Kitty Hawk Ln
- 271 Panacea Ln
- 4822 Georgia 115
- 111 On Golden Pond Ln
- 328 Panacea Ct
- 355 Zeb Bryson Rd
- 396 Haywood Hills Rd
- 385 Amys Rd
- 128 Crest Winds Dr
- 147 Crest Winds Dr
- 166 Poplar Springs Dr
- 127 Poplar Mill Rd
- 1.0 ACRES-B Bar Rod Rd
- 234 Dh Green Rd
- 715 Ridge Rd
- 1935 Sam Bell Rd
- 1955 Alec Mountain Rd
- 555 Highway 197 N
- 350 Eagles Nest Dr
- 342 Eagles Nest Dr
- 384 Eagles Nest Dr Unit 5
- 384 Eagles Nest Dr
- 338 Eagles Nest Dr Unit 8
- 338 Eagles Nest Dr
- 957 Highway 17
- 311 Eagles Nest Dr
- 829 Georgia 17
- 829 Highway 17
- 829 Highway 17
- 851 Georgia 17
- 389 Eagles Nest Dr
- 412 Eagles Nest Dr
- 825 Highway 17
- 825 Highway 17
- 405 Eagles Nest Dr
- 291 Eagles Nest Dr
- 286 Eagles Nest Dr
- 205 Eagles Nest Dr