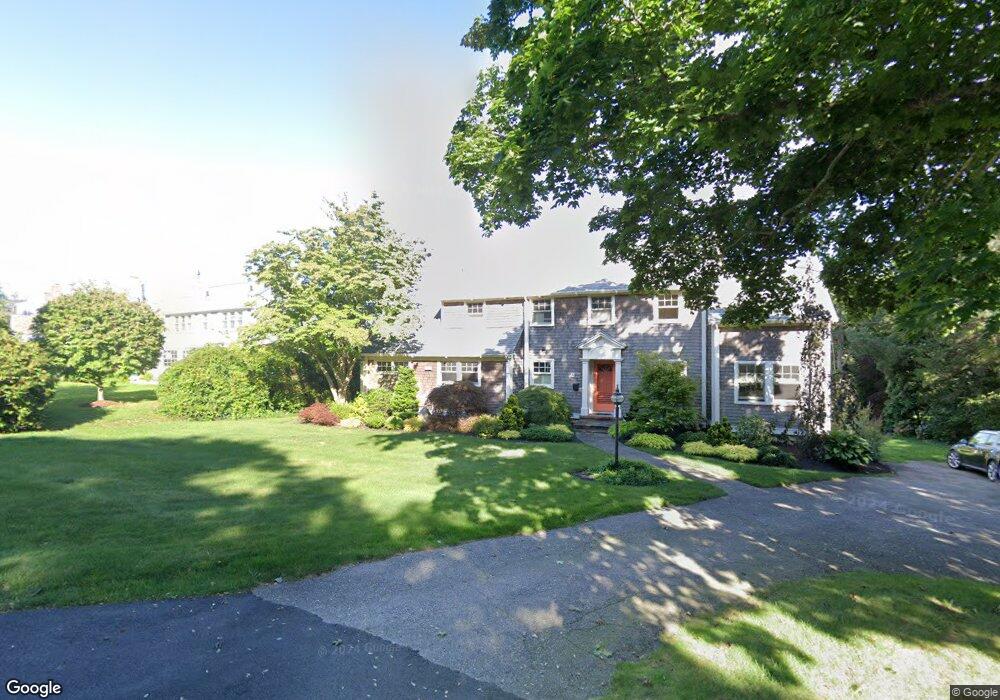
350 Elm Rd Falmouth, MA 02540
Falmouth Village NeighborhoodEstimated Value: $2,041,000 - $2,666,000
4
Beds
4
Baths
5,100
Sq Ft
$474/Sq Ft
Est. Value
About This Home
This home is located at 350 Elm Rd, Falmouth, MA 02540 and is currently estimated at $2,418,372, approximately $474 per square foot. 350 Elm Rd is a home located in Barnstable County with nearby schools including Mullen-Hall School, Lawrence School, and Morse Pond School.
Ownership History
Date
Name
Owned For
Owner Type
Purchase Details
Closed on
Mar 29, 2019
Sold by
Jacob Neil J and Jacob Laurie W
Bought by
Neil J Jacob 2019 T J and Neil Jacob
Current Estimated Value
Purchase Details
Closed on
Nov 9, 2011
Sold by
Marshall
Bought by
Jacob Neil J and Jacob Laurie W
Home Financials for this Owner
Home Financials are based on the most recent Mortgage that was taken out on this home.
Original Mortgage
$417,000
Interest Rate
3.28%
Mortgage Type
Purchase Money Mortgage
Create a Home Valuation Report for This Property
The Home Valuation Report is an in-depth analysis detailing your home's value as well as a comparison with similar homes in the area
Home Values in the Area
Average Home Value in this Area
Purchase History
| Date | Buyer | Sale Price | Title Company |
|---|---|---|---|
| Neil J Jacob 2019 T J | -- | -- | |
| Jacob Neil J | $942,500 | -- | |
| Jacob Neil J | $942,500 | -- | |
| Jacob Neil J | $942,500 | -- |
Source: Public Records
Mortgage History
| Date | Status | Borrower | Loan Amount |
|---|---|---|---|
| Previous Owner | Jacob Neil J | $417,000 | |
| Previous Owner | Jacob Neil J | $313,000 | |
| Previous Owner | Jacob Neil J | $425,000 |
Source: Public Records
Tax History Compared to Growth
Tax History
| Year | Tax Paid | Tax Assessment Tax Assessment Total Assessment is a certain percentage of the fair market value that is determined by local assessors to be the total taxable value of land and additions on the property. | Land | Improvement |
|---|---|---|---|---|
| 2025 | $11,613 | $1,978,400 | $934,300 | $1,044,100 |
| 2024 | $11,281 | $1,796,400 | $849,300 | $947,100 |
| 2023 | $9,824 | $1,419,700 | $627,800 | $791,900 |
| 2022 | $9,895 | $1,229,200 | $572,500 | $656,700 |
| 2021 | $9,173 | $1,079,200 | $547,600 | $531,600 |
| 2020 | $8,843 | $1,029,400 | $497,800 | $531,600 |
| 2019 | $8,770 | $1,024,500 | $497,800 | $526,700 |
| 2018 | $8,585 | $998,300 | $497,800 | $500,500 |
| 2017 | $8,377 | $982,100 | $497,800 | $484,300 |
| 2016 | $8,244 | $984,900 | $497,800 | $487,100 |
| 2015 | $8,066 | $984,900 | $497,800 | $487,100 |
| 2014 | $7,928 | $972,700 | $518,400 | $454,300 |
Source: Public Records
Map
Nearby Homes
- 38 Landfall Unit 38
- 38 Landfall
- 87 Oyster Pond Rd
- 15 Hedge Ln
- 251 Woods Hole Rd
- 65 Walker St
- 71 Main St
- 98 Main St
- 98 Main St Unit 1
- 44 Carey Ln
- 30 Katherine Lee Bates Rd
- 76 F r Lillie Rd
- 33 Oakwood Ave
- 45 Haynes Ave
- 29 Wilson Rd
- 27 Upland Ave
- 480 Main St Unit 1
- 253 Scranton Ave
- 110 Dillingham Ave Unit 322
- 110 Dillingham Ave Unit 224