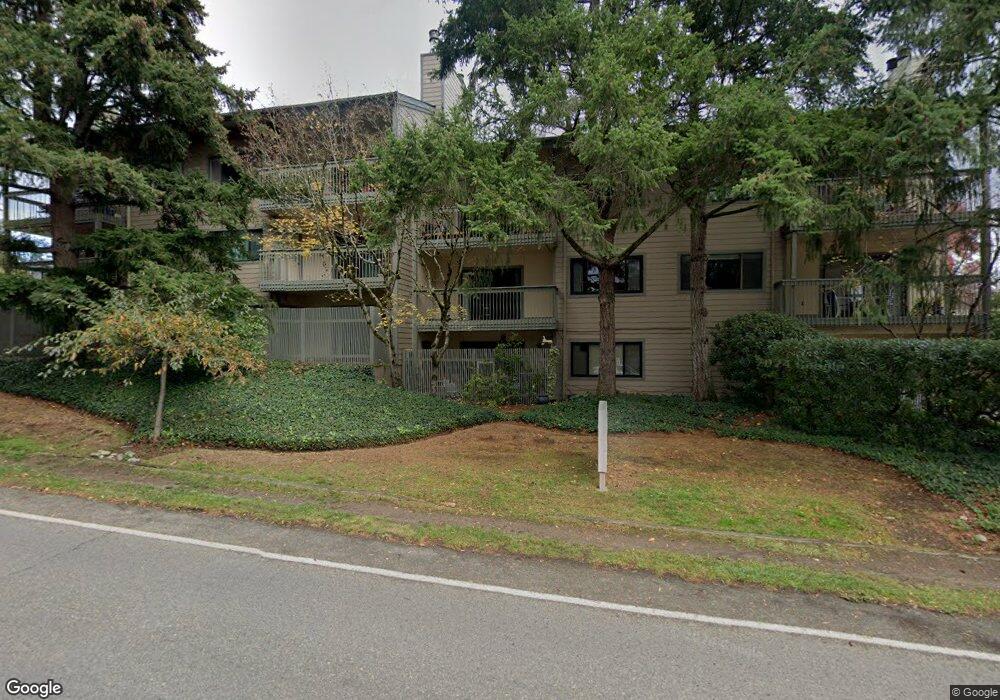
350 Grow Ave NW Unit A08 Bainbridge Island, WA 98110
Estimated Value: $481,393 - $646,000
2
Beds
2
Baths
1,167
Sq Ft
$490/Sq Ft
Est. Value
About This Home
This home is located at 350 Grow Ave NW Unit A08, Bainbridge Island, WA 98110 and is currently estimated at $571,348, approximately $489 per square foot. 350 Grow Ave NW Unit A08 is a home located in Kitsap County with nearby schools including Bainbridge High School, Madrona School, and St. Cecilia Catholic School.
Ownership History
Date
Name
Owned For
Owner Type
Purchase Details
Closed on
Jan 23, 2001
Sold by
Bush Andrew and Bush Shannon
Bought by
Cote Kenneth R
Current Estimated Value
Home Financials for this Owner
Home Financials are based on the most recent Mortgage that was taken out on this home.
Original Mortgage
$100,000
Outstanding Balance
$36,548
Interest Rate
7.41%
Estimated Equity
$534,800
Purchase Details
Closed on
Apr 25, 2000
Sold by
Adams Henry F and Adams Virginia P
Bought by
Bush Andrew and Bush Shannon
Home Financials for this Owner
Home Financials are based on the most recent Mortgage that was taken out on this home.
Original Mortgage
$103,500
Interest Rate
7.87%
Purchase Details
Closed on
Dec 21, 1998
Sold by
Vangesen James
Bought by
Adams Henry F and Adams Virginia P
Home Financials for this Owner
Home Financials are based on the most recent Mortgage that was taken out on this home.
Original Mortgage
$73,500
Interest Rate
7.12%
Create a Home Valuation Report for This Property
The Home Valuation Report is an in-depth analysis detailing your home's value as well as a comparison with similar homes in the area
Home Values in the Area
Average Home Value in this Area
Purchase History
| Date | Buyer | Sale Price | Title Company |
|---|---|---|---|
| Cote Kenneth R | $156,000 | First American Title Ins Co | |
| Bush Andrew | $115,000 | Pacific Nw Title | |
| Adams Henry F | $105,000 | Pacific Nw Title |
Source: Public Records
Mortgage History
| Date | Status | Borrower | Loan Amount |
|---|---|---|---|
| Open | Cote Kenneth R | $100,000 | |
| Previous Owner | Bush Andrew | $103,500 | |
| Previous Owner | Adams Henry F | $73,500 |
Source: Public Records
Tax History Compared to Growth
Tax History
| Year | Tax Paid | Tax Assessment Tax Assessment Total Assessment is a certain percentage of the fair market value that is determined by local assessors to be the total taxable value of land and additions on the property. | Land | Improvement |
|---|---|---|---|---|
| 2026 | $3,651 | $432,250 | -- | $432,250 |
| 2025 | $3,651 | $432,250 | -- | $432,250 |
| 2024 | $3,491 | $432,250 | -- | $432,250 |
| 2023 | $3,630 | $432,250 | $0 | $432,250 |
| 2022 | $3,682 | $375,870 | $0 | $375,870 |
| 2021 | $3,844 | $375,870 | $0 | $375,870 |
| 2020 | $3,558 | $341,700 | $0 | $341,700 |
| 2019 | $3,330 | $325,430 | $0 | $325,430 |
| 2018 | $2,891 | $227,570 | $0 | $227,570 |
| 2017 | $2,484 | $227,570 | $0 | $227,570 |
| 2016 | $1,967 | $169,450 | $0 | $169,450 |
| 2015 | $1,844 | $161,380 | $0 | $161,380 |
| 2014 | -- | $161,380 | $0 | $161,380 |
| 2013 | -- | $161,380 | $0 | $161,380 |
Source: Public Records
Map
Nearby Homes
- 214 Shepard Way NW
- 230 Canopy Path NW
- 224 Canopy Path NW
- 204 Shepard Way NW
- 144 Hall Brothers Loop NW Unit 101
- 200 Shepard Way NW
- 259 Shepard Way NW Unit 204
- 392 Wills Ln NW
- 522 Madrona Way NE Unit 4
- 141 Parfitt Way SW Unit A-35
- 141 Parfitt Way SW Unit M-10
- 774 Madison Ave N Unit B774
- 171 Wallace Way NE Unit B
- 465 Winslow Way E Unit 108
- 620 NE Vineyard Ln Unit B302
- 752 NE Vineyard Ln Unit L205
- 610 NE Vineyard Ln Unit A104
- 1240 Weaver Rd NW Unit B1
- 8277 New Holland Ct NE
- 300 High School Rd NE Unit 203
- 350 Grow Ave NW Unit A II
- 350 Grow Ave NW Unit A11
- 350 Grow Ave NW Unit A10
- 350 Grow Ave NW Unit A1
- 350 Grow Ave NW Unit A5
- 350 Grow Ave NW Unit A2
- 350 Grow Ave NW Unit A3
- 350 Grow Ave NW Unit A-7
- 350 Grow Ave NW
- 360 Grow Ave NW Unit B-4
- 382 Shepard Way NW
- 386 Shepard Way NW
- 302 Grow Ave NW
- 344 Shepard Way NW
- 330 Grow Ave NW Unit C8
- 330 Grow Ave NW
- 330 Grow Ave NW Unit C10
- 330 Grow Ave NW Unit C7
- 330 Grow Ave NW Unit C6
- 330 Grow Ave NW Unit C5