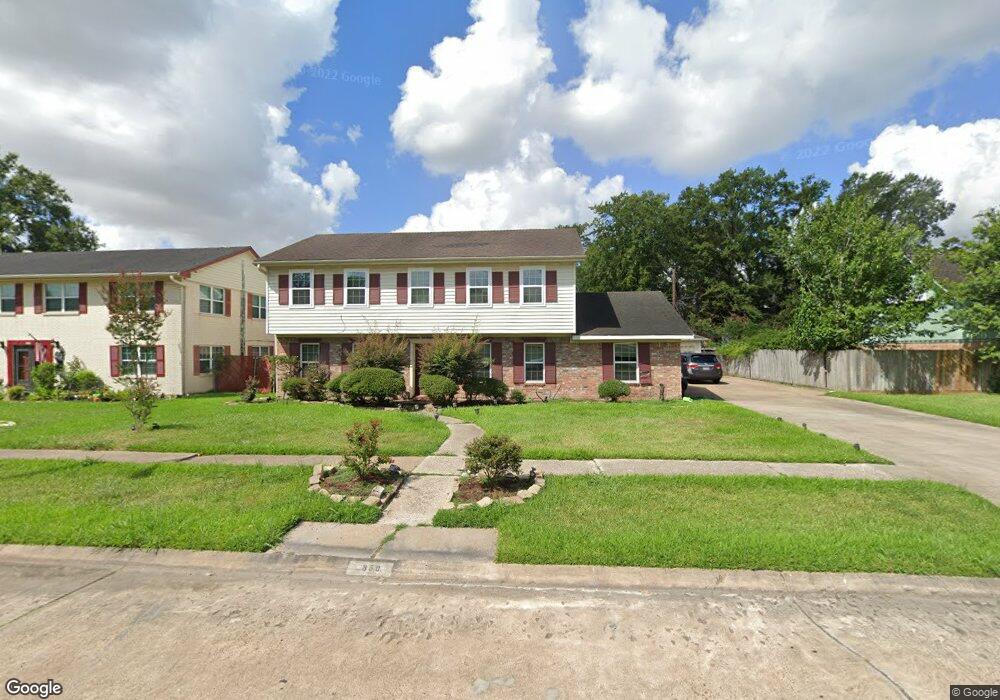
350 Kingscourt Dr Houston, TX 77015
Estimated Value: $300,000 - $321,361
4
Beds
4
Baths
2,941
Sq Ft
$106/Sq Ft
Est. Value
About This Home
This home is located at 350 Kingscourt Dr, Houston, TX 77015 and is currently estimated at $312,840, approximately $106 per square foot. 350 Kingscourt Dr is a home located in Harris County with nearby schools including James B. Havard Elementary School, Cobb 6th Grade Campus, and North Shore Middle School.
Ownership History
Date
Name
Owned For
Owner Type
Purchase Details
Closed on
Mar 5, 2009
Sold by
Grimes Randall C and Grimes Lydia B
Bought by
Foster Tina
Current Estimated Value
Home Financials for this Owner
Home Financials are based on the most recent Mortgage that was taken out on this home.
Original Mortgage
$152,192
Outstanding Balance
$96,773
Interest Rate
5.13%
Mortgage Type
FHA
Estimated Equity
$216,067
Purchase Details
Closed on
Jun 28, 2000
Sold by
Deinum Charles H and Deinum Carole L
Bought by
Grimes Randall C and Grimes Lydia B
Home Financials for this Owner
Home Financials are based on the most recent Mortgage that was taken out on this home.
Original Mortgage
$150,100
Interest Rate
8.66%
Mortgage Type
Purchase Money Mortgage
Purchase Details
Closed on
Nov 9, 1995
Sold by
National Credit Union Share Ins Fund
Bought by
Deinum Charles
Create a Home Valuation Report for This Property
The Home Valuation Report is an in-depth analysis detailing your home's value as well as a comparison with similar homes in the area
Home Values in the Area
Average Home Value in this Area
Purchase History
| Date | Buyer | Sale Price | Title Company |
|---|---|---|---|
| Foster Tina | -- | Texas American Title Company | |
| Grimes Randall C | -- | Texas American Title Company | |
| Deinum Charles | -- | Stewart Title |
Source: Public Records
Mortgage History
| Date | Status | Borrower | Loan Amount |
|---|---|---|---|
| Open | Foster Tina | $152,192 | |
| Previous Owner | Grimes Randall C | $150,100 |
Source: Public Records
Tax History Compared to Growth
Tax History
| Year | Tax Paid | Tax Assessment Tax Assessment Total Assessment is a certain percentage of the fair market value that is determined by local assessors to be the total taxable value of land and additions on the property. | Land | Improvement |
|---|---|---|---|---|
| 2025 | $700 | $286,849 | $68,388 | $218,461 |
| 2024 | $700 | $298,205 | $51,291 | $246,914 |
| 2023 | $700 | $345,079 | $51,291 | $293,788 |
| 2022 | $5,313 | $298,345 | $51,291 | $247,054 |
| 2021 | $5,254 | $242,035 | $40,178 | $201,857 |
| 2020 | $4,872 | $207,835 | $40,178 | $167,657 |
| 2019 | $4,629 | $171,673 | $36,613 | $135,060 |
| 2018 | $1,264 | $171,673 | $36,613 | $135,060 |
| 2017 | $4,628 | $171,673 | $36,613 | $135,060 |
| 2016 | $4,320 | $161,668 | $28,767 | $132,901 |
| 2015 | $1,445 | $157,037 | $28,767 | $128,270 |
| 2014 | $1,445 | $132,448 | $28,767 | $103,681 |
Source: Public Records
Map
Nearby Homes
- 346 Ballantrae Ln
- 13915 Roundstone Ln
- 13907 Duncannon Dr
- 13415 Castilian Dr Unit 1
- 13911 Waterville Way
- 505 Evanston St
- 242 Saint Finans Way
- 13529 Granada St
- 13527 Castilian Dr Unit 1
- 330 Breeze Park Dr
- 326 Breeze Park Dr
- 271 Shekel Ln
- 14018 Duncannon Dr
- 13426 Whitchurch Way
- 13480 S Thorntree Dr Unit 1206
- 13480 S Thorntree Dr Unit 1004
- 13480 S Thorntree Dr Unit 508
- 13480 S Thorntree Dr Unit 910
- 415 Sevenhampton Ln
- 13351 Oak Leaf Ln
- 366 Kingscourt Dr
- 346 Kingscourt Dr
- 363 Connaught Way
- 370 Kingscourt Dr
- 342 Kingscourt Dr
- 359 Connaught Way
- 351 Kingscourt Dr
- 371 Connaught Way
- 369 Kingscourt Dr
- 343 Kingscourt Dr
- 338 Kingscourt Dr
- 355 Connaught Way
- 350 Stonehenge Ln
- 339 Kingscourt Dr
- 366 Connaught Way
- 378 Kingscourt Dr
- 362 Connaught Way
- 346 Stonehenge Ln
- 362 Stonehenge Ln
- 375 Connaught Way