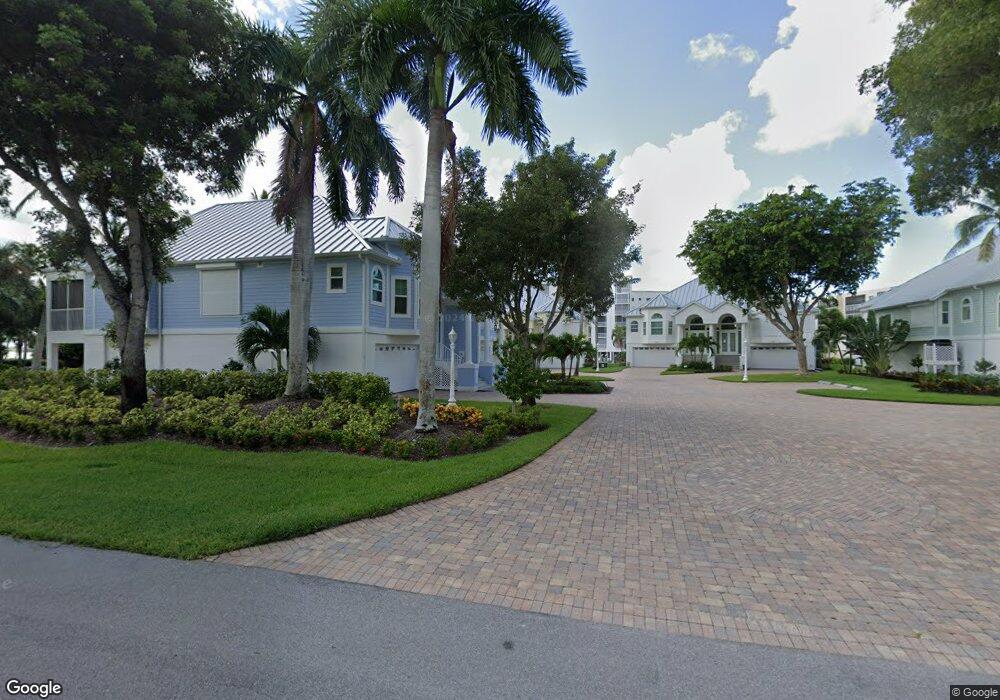
350 Lenell Rd Unit 6A Fort Myers Beach, FL 33931
Estimated Value: $774,000 - $1,186,000
3
Beds
3
Baths
1,961
Sq Ft
$508/Sq Ft
Est. Value
About This Home
This home is located at 350 Lenell Rd Unit 6A, Fort Myers Beach, FL 33931 and is currently estimated at $997,136, approximately $508 per square foot. 350 Lenell Rd Unit 6A is a home located in Lee County with nearby schools including Fort Myers Beach Elementary School, Bonita Springs Middle Center for the Arts, and Cypress Lake Middle School.
Ownership History
Date
Name
Owned For
Owner Type
Purchase Details
Closed on
Dec 6, 2021
Sold by
Nutial George W and Nutial Judy R
Bought by
Nutial George W and Nutial Judy R
Current Estimated Value
Purchase Details
Closed on
Mar 15, 2011
Sold by
Slack John A and Slack Kathleen M
Bought by
Nutial George W and Nutial Judy R
Home Financials for this Owner
Home Financials are based on the most recent Mortgage that was taken out on this home.
Original Mortgage
$272,000
Outstanding Balance
$12,536
Interest Rate
4.77%
Mortgage Type
New Conventional
Estimated Equity
$984,600
Purchase Details
Closed on
Jan 10, 2002
Sold by
Fl Inv & Merchandizing Inc
Bought by
Slack John A and Slack Kathleen A
Home Financials for this Owner
Home Financials are based on the most recent Mortgage that was taken out on this home.
Original Mortgage
$275,000
Interest Rate
6.81%
Create a Home Valuation Report for This Property
The Home Valuation Report is an in-depth analysis detailing your home's value as well as a comparison with similar homes in the area
Home Values in the Area
Average Home Value in this Area
Purchase History
| Date | Buyer | Sale Price | Title Company |
|---|---|---|---|
| Nutial George W | -- | Attorney | |
| Nutial George W | $389,900 | Accent Title Ins Agency Inc | |
| Slack John A | $365,000 | -- |
Source: Public Records
Mortgage History
| Date | Status | Borrower | Loan Amount |
|---|---|---|---|
| Open | Nutial George W | $272,000 | |
| Previous Owner | Slack John A | $275,000 |
Source: Public Records
Tax History Compared to Growth
Tax History
| Year | Tax Paid | Tax Assessment Tax Assessment Total Assessment is a certain percentage of the fair market value that is determined by local assessors to be the total taxable value of land and additions on the property. | Land | Improvement |
|---|---|---|---|---|
| 2025 | $7,957 | $559,840 | -- | $556,025 |
| 2024 | $1,920 | $569,843 | -- | $565,919 |
| 2023 | $1,920 | $117,180 | $0 | $117,180 |
| 2022 | $10,561 | $603,200 | $0 | $0 |
| 2021 | $8,130 | $548,364 | $0 | $548,364 |
| 2020 | $8,216 | $541,025 | $0 | $541,025 |
| 2019 | $8,888 | $583,015 | $0 | $583,015 |
| 2018 | $8,568 | $583,823 | $0 | $583,823 |
| 2017 | $8,339 | $586,245 | $0 | $586,245 |
| 2016 | $7,641 | $520,279 | $0 | $520,279 |
| 2015 | $7,231 | $489,700 | $0 | $489,700 |
| 2014 | -- | $458,800 | $0 | $458,800 |
| 2013 | -- | $439,700 | $0 | $439,700 |
Source: Public Records
Map
Nearby Homes
- 281 Lenell Rd Unit 1 (7-A)
- 271 Lenell Rd Unit 6D
- 4341 Bay Beach Ln
- 4341 Bay Beach Ln Unit 644
- 221 Lenell Rd Unit 5A
- 200 Lenell Rd Unit 214
- 200 Lenell Rd Unit 324
- 200 Lenell Rd Unit 215
- 4351 Bay Beach Ln Unit 332
- 400 Lenell Rd Unit 306
- 400 Lenell Rd Unit 207
- 400 Lenell Rd Unit 110
- 4431 Bay Beach Ln Unit 543
- 4331 Bay Beach Ln Unit 353
- 4265 Bay Beach Ln Unit 425
- 4265 Bay Beach Ln Unit 226
- 4265 Bay Beach Ln Unit 524
- 4265 Bay Beach Ln Unit 523
- 4421 Bay Beach Ln Unit 614
- 4481 Bay Beach Ln Unit 214
- 352 Lenell Rd Unit 6B
- 340 Lenell Rd Unit 5A
- 342 Lenell Rd Unit 5B
- 360 Lenell Rd
- 362 Lenell Rd
- 372 Lenell Rd
- 370 Lenell Rd Unit 8A
- 316 Lenell Rd
- 332 Lenell Rd
- 332 Lenell Rd Unit 4B
- 330 Lenell Rd Unit 4A
- 322 Lenell Rd
- 320 Lenell Rd Unit 3A
- 4341 Bay Beach Ln Unit 86
- 4341 Bay Beach Ln
- 4341 Bay Beach Ln
- 4341 Bay Beach Ln Unit 341
- 4341 Bay Beach Ln Unit 143
- 4341 Bay Beach Ln Unit 443
- 4341 Bay Beach Ln Unit 243