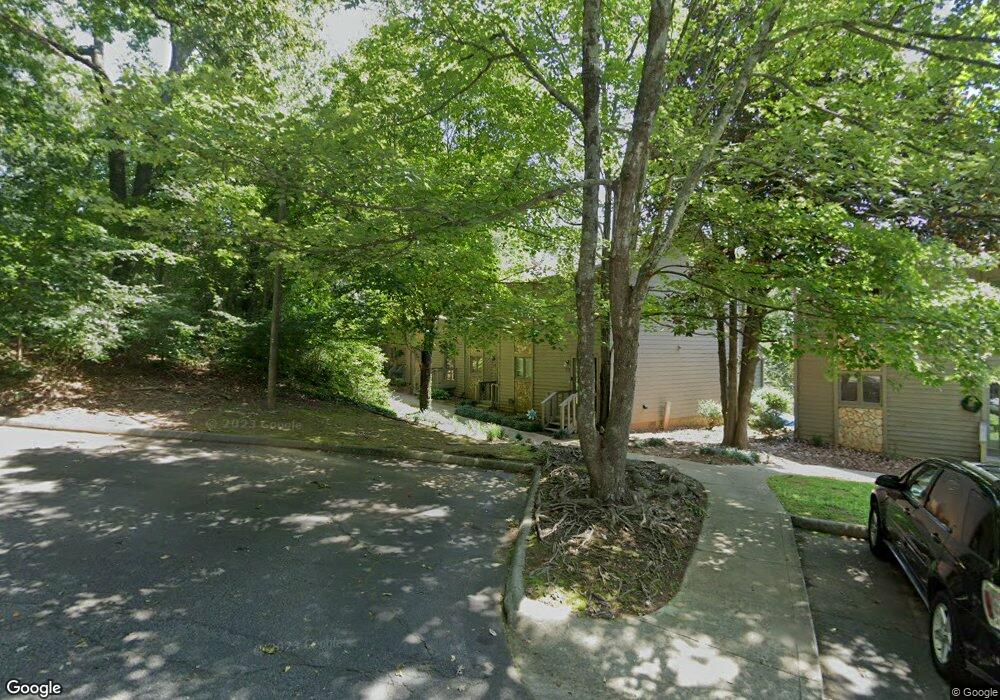
350 Mtn Creek Ch Rd Unit 1 Greenville, SC 29609
Estimated Value: $187,000 - $284,000
2
Beds
2
Baths
1,152
Sq Ft
$184/Sq Ft
Est. Value
About This Home
This home is located at 350 Mtn Creek Ch Rd Unit 1, Greenville, SC 29609 and is currently estimated at $212,046, approximately $184 per square foot. 350 Mtn Creek Ch Rd Unit 1 is a home located in Greenville County with nearby schools including Paris Elementary School, Sevier Middle, and Wade Hampton High.
Ownership History
Date
Name
Owned For
Owner Type
Purchase Details
Closed on
Sep 26, 2025
Sold by
Gardner Leslie E
Bought by
Bright Wesley M
Current Estimated Value
Home Financials for this Owner
Home Financials are based on the most recent Mortgage that was taken out on this home.
Original Mortgage
$185,576
Outstanding Balance
$185,576
Interest Rate
6.58%
Mortgage Type
FHA
Estimated Equity
$26,470
Purchase Details
Closed on
Jul 28, 2006
Sold by
Trahan Kenneth P
Bought by
Gardner Leslie E
Home Financials for this Owner
Home Financials are based on the most recent Mortgage that was taken out on this home.
Original Mortgage
$87,797
Interest Rate
6.71%
Mortgage Type
VA
Purchase Details
Closed on
Jun 3, 2004
Sold by
Stone James P
Bought by
Trahan Ken
Purchase Details
Closed on
May 2, 2001
Sold by
Mason Tammy M
Bought by
Stone James P
Create a Home Valuation Report for This Property
The Home Valuation Report is an in-depth analysis detailing your home's value as well as a comparison with similar homes in the area
Home Values in the Area
Average Home Value in this Area
Purchase History
| Date | Buyer | Sale Price | Title Company |
|---|---|---|---|
| Bright Wesley M | $189,000 | None Listed On Document | |
| Gardner Leslie E | $93,000 | None Available | |
| Trahan Ken | $86,400 | -- | |
| Stone James P | $80,000 | -- |
Source: Public Records
Mortgage History
| Date | Status | Borrower | Loan Amount |
|---|---|---|---|
| Open | Bright Wesley M | $185,576 | |
| Previous Owner | Gardner Leslie E | $87,797 |
Source: Public Records
Tax History Compared to Growth
Tax History
| Year | Tax Paid | Tax Assessment Tax Assessment Total Assessment is a certain percentage of the fair market value that is determined by local assessors to be the total taxable value of land and additions on the property. | Land | Improvement |
|---|---|---|---|---|
| 2024 | $392 | $3,810 | $600 | $3,210 |
| 2023 | $392 | $3,810 | $600 | $3,210 |
| 2022 | $365 | $3,810 | $600 | $3,210 |
| 2021 | $423 | $3,810 | $600 | $3,210 |
| 2020 | $387 | $3,480 | $600 | $2,880 |
| 2019 | $383 | $3,480 | $600 | $2,880 |
| 2018 | $378 | $3,480 | $600 | $2,880 |
| 2017 | $374 | $3,480 | $600 | $2,880 |
| 2016 | $349 | $87,120 | $15,000 | $72,120 |
| 2015 | $317 | $87,120 | $15,000 | $72,120 |
| 2014 | $349 | $92,350 | $14,752 | $77,598 |
Source: Public Records
Map
Nearby Homes
- 108 Sandtrap Ct
- 2 Creekside Way
- 4 Creekside Way
- 32 Creekside Way
- 12 Creekside Way
- 101 Pebble Stone Ln
- 304 Oak Brook Way
- 8 Pebble Stone Ln
- 8 Spyglass Ct
- 11 Tall Tree Ln
- 24 Robin Hood Rd
- 120 Beaumont Creek Ln
- 5 Robin Hood Rd
- 3 Fox Ridge Point
- 0 Tanner Rd
- 2 Club Pointe
- 10 Hannah Springs Ct
- 80 Madeline Cir
- 4 Sandstone Ct
- 43 Birdsong Ln
- 350 Mtn Creek Ch Rd Unit 1
- 350 Mtn Creek Ch Rd Unit 1
- 350 Mtn Creek Ch Rd Unit 1
- 350 Mtn Creek Ch Rd Unit 1
- 350 Mtn Creek Ch Rd Unit 1
- 350 Mtn Creek Ch Rd Unit 1
- 350 Mtn Creek Ch Rd Unit 1
- 350 Mtn Creek Ch Rd Unit 1
- 350 Mtn Creek Ch Rd Unit 2
- 350 Mtn Creek Ch Rd Unit 9
- 350 Mtn Creek Ch Rd Unit 8
- 350 Mtn Creek Ch Rd Unit 7
- 350 Mtn Creek Ch Rd Unit 6
- 350 Mtn Creek Ch Rd Unit 5
- 350 Mtn Creek Ch Rd Unit 1A
- 350 Mtn Creek Ch Rd Unit 3
- 350 Mtn Creek Ch Rd Unit 2
- 350 Mtn Creek Ch Rd Unit 1
- 350 W Mountain Creek Church Rd Unit 4
- 350 Mountain Creek Church Rd Unit 13