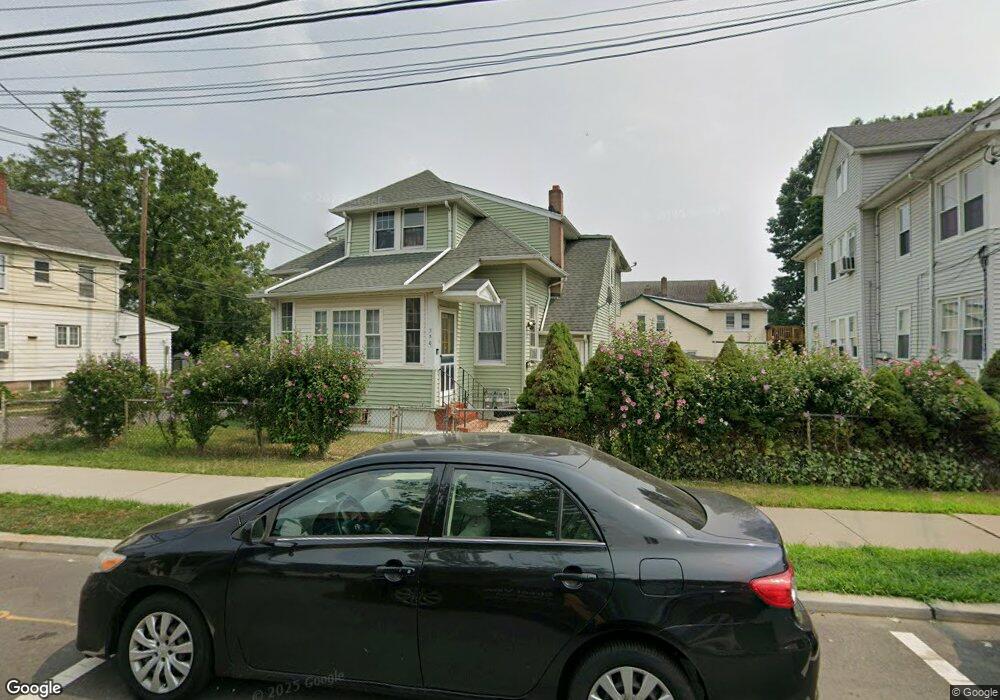
350 N 11th St Prospect Park, NJ 07508
Estimated Value: $659,060 - $854,000
--
Bed
--
Bath
2,504
Sq Ft
$295/Sq Ft
Est. Value
About This Home
This home is located at 350 N 11th St, Prospect Park, NJ 07508 and is currently estimated at $739,765, approximately $295 per square foot. 350 N 11th St is a home located in Passaic County with nearby schools including Number 1, Prospect Park Elementary School, Manchester Reg High School, and Al-Hikmah Elementary School.
Ownership History
Date
Name
Owned For
Owner Type
Purchase Details
Closed on
Oct 1, 2024
Sold by
Patterson Layton
Bought by
Patterson Layton and Brown Corrette
Current Estimated Value
Purchase Details
Closed on
Jun 13, 2012
Sold by
Cameron Sitra
Bought by
Patterson Layton
Purchase Details
Closed on
Mar 23, 2000
Sold by
Delusso Victor
Bought by
Patterson Layton and Cameron Sitra
Home Financials for this Owner
Home Financials are based on the most recent Mortgage that was taken out on this home.
Original Mortgage
$223,000
Interest Rate
8.26%
Purchase Details
Closed on
Mar 13, 1998
Sold by
Ozgen Magdalena
Bought by
Delusso Victor
Home Financials for this Owner
Home Financials are based on the most recent Mortgage that was taken out on this home.
Original Mortgage
$136,000
Interest Rate
6.96%
Create a Home Valuation Report for This Property
The Home Valuation Report is an in-depth analysis detailing your home's value as well as a comparison with similar homes in the area
Home Values in the Area
Average Home Value in this Area
Purchase History
| Date | Buyer | Sale Price | Title Company |
|---|---|---|---|
| Patterson Layton | -- | None Listed On Document | |
| Patterson Layton | -- | None Listed On Document | |
| Patterson Layton | -- | None Available | |
| Patterson Layton | $235,000 | -- | |
| Delusso Victor | $170,000 | Chicago Title Insurance Co |
Source: Public Records
Mortgage History
| Date | Status | Borrower | Loan Amount |
|---|---|---|---|
| Previous Owner | Patterson Layton | $223,000 | |
| Previous Owner | Delusso Victor | $136,000 |
Source: Public Records
Tax History Compared to Growth
Tax History
| Year | Tax Paid | Tax Assessment Tax Assessment Total Assessment is a certain percentage of the fair market value that is determined by local assessors to be the total taxable value of land and additions on the property. | Land | Improvement |
|---|---|---|---|---|
| 2025 | $18,043 | $303,200 | $67,100 | $236,100 |
| 2024 | $16,743 | $303,200 | $67,100 | $236,100 |
| 2022 | $16,564 | $303,200 | $67,100 | $236,100 |
| 2021 | $16,376 | $303,200 | $67,100 | $236,100 |
| 2020 | $15,857 | $303,200 | $67,100 | $236,100 |
| 2019 | $15,694 | $303,200 | $67,100 | $236,100 |
| 2018 | $15,539 | $303,200 | $67,100 | $236,100 |
| 2017 | $15,321 | $303,200 | $67,100 | $236,100 |
| 2016 | $15,121 | $303,200 | $67,100 | $236,100 |
| 2015 | $14,299 | $303,200 | $67,100 | $236,100 |
| 2014 | $11,217 | $169,900 | $50,000 | $119,900 |
Source: Public Records
Map
Nearby Homes