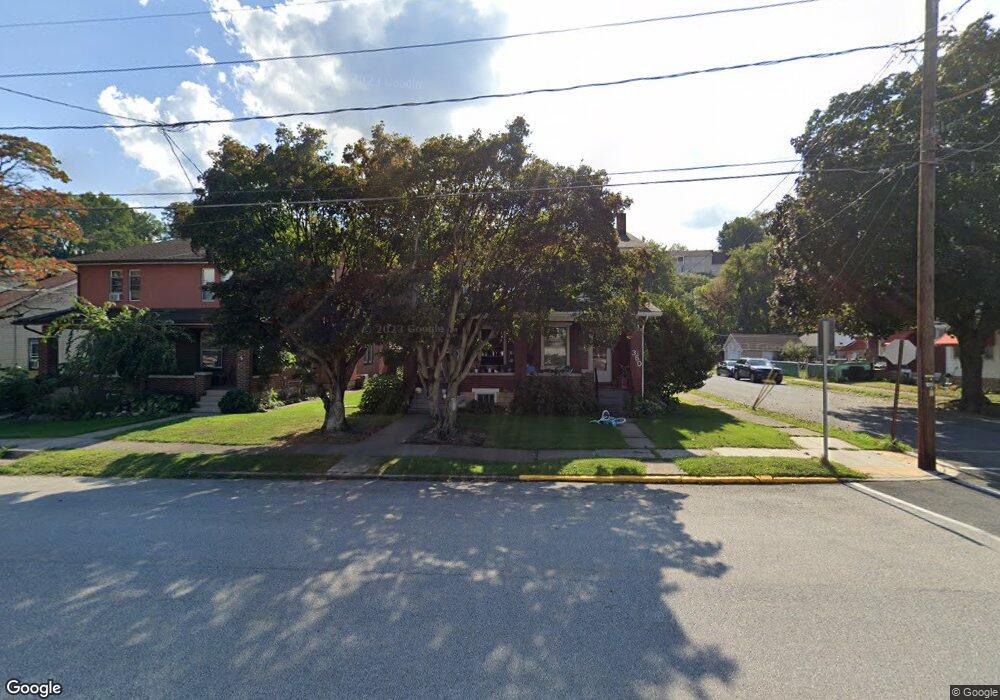
350 N 2nd St Lemoyne, PA 17043
Estimated Value: $197,000 - $237,000
3
Beds
2
Baths
1,350
Sq Ft
$160/Sq Ft
Est. Value
About This Home
This home is located at 350 N 2nd St, Lemoyne, PA 17043 and is currently estimated at $216,138, approximately $160 per square foot. 350 N 2nd St is a home located in Cumberland County with nearby schools including Washington Heights Elementary School, New Cumberland Middle School, and Page County Middle School.
Ownership History
Date
Name
Owned For
Owner Type
Purchase Details
Closed on
Oct 25, 2019
Sold by
Lazeration Charles R and Lazeration Michelle K
Bought by
Alvarez Lucille and Charleton Eric B
Current Estimated Value
Home Financials for this Owner
Home Financials are based on the most recent Mortgage that was taken out on this home.
Original Mortgage
$132,456
Outstanding Balance
$116,873
Interest Rate
3.75%
Mortgage Type
FHA
Estimated Equity
$99,265
Purchase Details
Closed on
Dec 28, 1999
Sold by
Dimou Lydia E
Bought by
Lazeration Charles R
Home Financials for this Owner
Home Financials are based on the most recent Mortgage that was taken out on this home.
Original Mortgage
$86,455
Interest Rate
7.71%
Create a Home Valuation Report for This Property
The Home Valuation Report is an in-depth analysis detailing your home's value as well as a comparison with similar homes in the area
Home Values in the Area
Average Home Value in this Area
Purchase History
| Date | Buyer | Sale Price | Title Company |
|---|---|---|---|
| Alvarez Lucille | $134,900 | None Available | |
| Lazeration Charles R | $86,500 | -- |
Source: Public Records
Mortgage History
| Date | Status | Borrower | Loan Amount |
|---|---|---|---|
| Open | Alvarez Lucille | $132,456 | |
| Previous Owner | Lazeration Charles R | $86,455 |
Source: Public Records
Tax History Compared to Growth
Tax History
| Year | Tax Paid | Tax Assessment Tax Assessment Total Assessment is a certain percentage of the fair market value that is determined by local assessors to be the total taxable value of land and additions on the property. | Land | Improvement |
|---|---|---|---|---|
| 2025 | $2,379 | $111,100 | $27,400 | $83,700 |
| 2024 | $2,232 | $111,100 | $27,400 | $83,700 |
| 2023 | $2,139 | $111,100 | $27,400 | $83,700 |
| 2022 | $2,089 | $111,100 | $27,400 | $83,700 |
| 2021 | $2,028 | $111,100 | $27,400 | $83,700 |
| 2020 | $1,987 | $111,100 | $27,400 | $83,700 |
| 2019 | $1,930 | $111,100 | $27,400 | $83,700 |
| 2018 | $1,880 | $111,100 | $27,400 | $83,700 |
| 2017 | $1,849 | $111,100 | $27,400 | $83,700 |
| 2016 | -- | $111,100 | $27,400 | $83,700 |
| 2015 | -- | $111,100 | $27,400 | $83,700 |
| 2014 | -- | $111,100 | $27,400 | $83,700 |
Source: Public Records
Map
Nearby Homes
- 404 N 2nd St
- 443 N 2nd St
- 300 Stella St
- 46 N Front St
- 545 Bridgeview Dr
- 28 Brentwood Rd
- 908 W Walnut St
- 4 Westwind Dr
- 837 W Foxcroft Dr
- 919 Woodland Dr
- 531 Rupley Rd
- 811 Michigan Ave
- 316 Old Fort Rd
- 920 W Foxcroft Dr
- 1101 N Front St
- 407 N Front St
- 315 N Front St
- 215 Briggs St
- 107 Reily St
- 211 Cumberland St