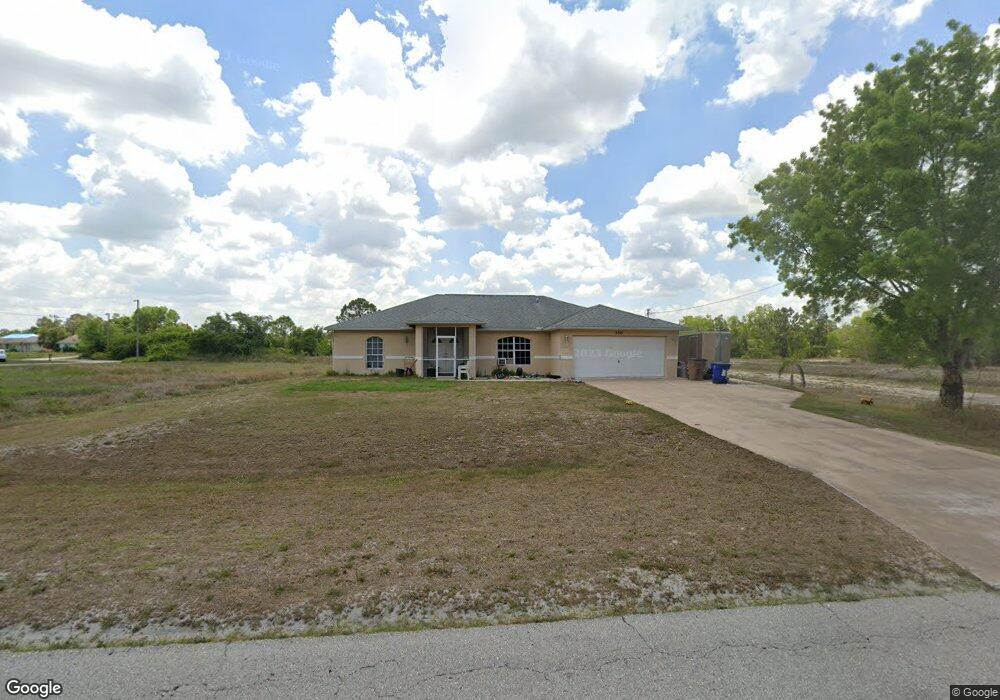
350 Parkdale Blvd Lehigh Acres, FL 33974
Parkdale NeighborhoodEstimated Value: $318,000 - $400,000
3
Beds
2
Baths
2,533
Sq Ft
$137/Sq Ft
Est. Value
About This Home
This home is located at 350 Parkdale Blvd, Lehigh Acres, FL 33974 and is currently estimated at $346,587, approximately $136 per square foot. 350 Parkdale Blvd is a home located in Lee County with nearby schools including Lehigh Elementary School, Gateway Elementary School, and The Alva School.
Ownership History
Date
Name
Owned For
Owner Type
Purchase Details
Closed on
Jan 31, 2014
Sold by
Asset Management Enterprises Llc
Bought by
Herold Dennis
Current Estimated Value
Purchase Details
Closed on
Sep 10, 2013
Sold by
Nationstar Mortgage Llc
Bought by
Asset Management Enterprises Llc
Purchase Details
Closed on
Jul 16, 2013
Sold by
Stevens Corrie L
Bought by
Nationstar Mortgage Llc
Purchase Details
Closed on
Oct 26, 2006
Sold by
Stevens Scott D and Stevens Corrie L
Bought by
Stevens Corrie L
Purchase Details
Closed on
Jun 14, 2002
Sold by
1St Home Bldr Fl
Bought by
Stevens Scott D and Stevens Corrie L
Home Financials for this Owner
Home Financials are based on the most recent Mortgage that was taken out on this home.
Original Mortgage
$145,547
Interest Rate
6.77%
Mortgage Type
FHA
Create a Home Valuation Report for This Property
The Home Valuation Report is an in-depth analysis detailing your home's value as well as a comparison with similar homes in the area
Home Values in the Area
Average Home Value in this Area
Purchase History
| Date | Buyer | Sale Price | Title Company |
|---|---|---|---|
| Herold Dennis | $128,000 | Florida Title One Llc | |
| Asset Management Enterprises Llc | $91,875 | Title365 Company | |
| Nationstar Mortgage Llc | $97,100 | None Available | |
| Stevens Corrie L | -- | Attorney | |
| Stevens Scott D | $8,500 | -- |
Source: Public Records
Mortgage History
| Date | Status | Borrower | Loan Amount |
|---|---|---|---|
| Previous Owner | Stevens Scott D | $145,547 |
Source: Public Records
Tax History Compared to Growth
Tax History
| Year | Tax Paid | Tax Assessment Tax Assessment Total Assessment is a certain percentage of the fair market value that is determined by local assessors to be the total taxable value of land and additions on the property. | Land | Improvement |
|---|---|---|---|---|
| 2025 | $4,133 | $269,225 | $35,530 | $220,198 |
| 2024 | $4,005 | $255,923 | -- | -- |
| 2023 | $4,005 | $232,657 | $0 | $0 |
| 2022 | $3,509 | $211,506 | $0 | $0 |
| 2021 | $3,050 | $192,278 | $7,093 | $185,185 |
| 2020 | $2,916 | $180,080 | $5,000 | $175,080 |
| 2019 | $2,743 | $163,922 | $4,700 | $159,222 |
| 2018 | $2,635 | $159,884 | $4,450 | $155,434 |
| 2017 | $2,533 | $155,030 | $4,210 | $150,820 |
| 2016 | $2,220 | $120,035 | $4,972 | $115,063 |
| 2015 | $2,109 | $112,090 | $4,385 | $107,705 |
| 2014 | -- | $102,596 | $3,802 | $98,794 |
| 2013 | -- | $88,505 | $6,678 | $81,827 |
Source: Public Records
Map
Nearby Homes
- 399 Martineau Cir
- 397 Martineau Cir Unit 118-27
- 308 Jourferie Rd
- 310 Jourferie Rd
- 311 Jourferie Rd
- 337 Jourferie Rd
- 393 Martineau Cir Unit 118-25
- 347 Parish Dr
- 348 Marta Dr
- 345 Parish Dr
- 346 Marta Dr
- 346 Martineau Cir Unit 119-02
- 387 Martineau Cir Unit 118-22
- 336 Parkdale Blvd
- 372 Clairidge Cir
- 386 Martineau Cir
- 419 Jaipur Dr
- 385 Martineau Cir Unit 118-21
- 352 Clairidge Cir
- 352 Claridge Cir
- 350 Clairidge Cir
- 350 Claridge Cir
- 357 Clairidge Cir
- 356 Parkdale Blvd
- 356 Clairidge Cir
- 341 Jourferie Rd
- 405 Jourferie Rd Unit 3
- 407 Jourferie Rd Unit 4
- 409 Jourferie Rd
- 358 Clairidge Cir
- 358 Parkdale Blvd
- 359 Clairidge Cir
- 359 Claridge Cir
- 413 Jourferie Rd
- 360 Clairidge Cir
- 360 Claridge Cir Unit 1