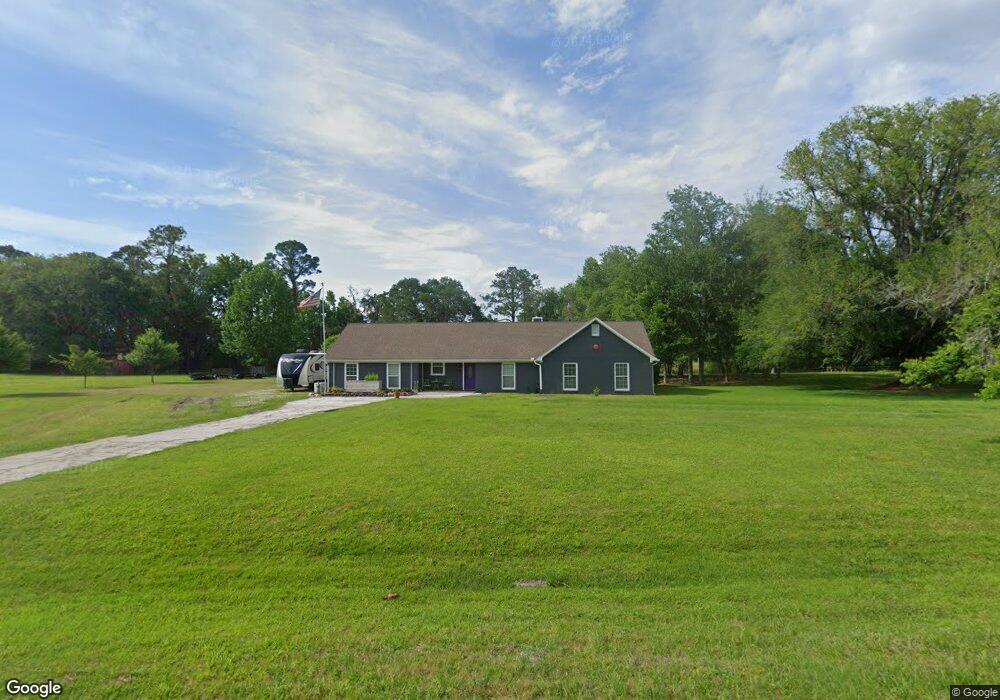
350 Plantation Point Woodbine, GA 31569
Estimated Value: $248,000 - $362,000
4
Beds
2
Baths
2,361
Sq Ft
$129/Sq Ft
Est. Value
About This Home
This home is located at 350 Plantation Point, Woodbine, GA 31569 and is currently estimated at $305,505, approximately $129 per square foot. 350 Plantation Point is a home located in Camden County with nearby schools including Woodbine Elementary School, Camden Middle School, and Camden County High School.
Ownership History
Date
Name
Owned For
Owner Type
Purchase Details
Closed on
Feb 21, 2018
Sold by
Burch Violet M
Bought by
Burch Lois E and Burch George K
Current Estimated Value
Purchase Details
Closed on
May 4, 2015
Sold by
Burch George K Vi
Bought by
Burch Lois E and Burch Violet M
Home Financials for this Owner
Home Financials are based on the most recent Mortgage that was taken out on this home.
Original Mortgage
$176,224
Interest Rate
3.8%
Mortgage Type
New Conventional
Purchase Details
Closed on
Jul 25, 2011
Sold by
Burch Kelly M
Bought by
Burch George K
Purchase Details
Closed on
May 1, 2006
Sold by
Not Provided
Bought by
Burch George K Vi
Home Financials for this Owner
Home Financials are based on the most recent Mortgage that was taken out on this home.
Original Mortgage
$160,000
Interest Rate
6.33%
Mortgage Type
New Conventional
Create a Home Valuation Report for This Property
The Home Valuation Report is an in-depth analysis detailing your home's value as well as a comparison with similar homes in the area
Home Values in the Area
Average Home Value in this Area
Purchase History
| Date | Buyer | Sale Price | Title Company |
|---|---|---|---|
| Burch Lois E | -- | -- | |
| Burch Lois E | $172,700 | -- | |
| Burch George K | -- | -- | |
| Burch George K Vi | $200,000 | -- |
Source: Public Records
Mortgage History
| Date | Status | Borrower | Loan Amount |
|---|---|---|---|
| Previous Owner | Burch Lois E | $176,224 | |
| Previous Owner | Burch George K Vi | $160,000 |
Source: Public Records
Tax History Compared to Growth
Tax History
| Year | Tax Paid | Tax Assessment Tax Assessment Total Assessment is a certain percentage of the fair market value that is determined by local assessors to be the total taxable value of land and additions on the property. | Land | Improvement |
|---|---|---|---|---|
| 2024 | $952 | $94,975 | $12,680 | $82,295 |
| 2023 | $1,634 | $94,975 | $12,680 | $82,295 |
| 2022 | $1,608 | $86,246 | $12,680 | $73,566 |
| 2021 | $1,701 | $72,175 | $12,680 | $59,495 |
| 2020 | $1,749 | $70,304 | $11,970 | $58,334 |
| 2019 | $1,762 | $70,304 | $11,970 | $58,334 |
| 2018 | $1,584 | $70,108 | $11,970 | $58,138 |
| 2017 | $1,619 | $65,116 | $11,970 | $53,146 |
| 2016 | $1,619 | $60,752 | $11,970 | $48,782 |
| 2015 | $1,558 | $56,888 | $11,970 | $44,918 |
| 2014 | $1,552 | $56,888 | $11,970 | $44,918 |
Source: Public Records
Map
Nearby Homes
- 13535 Georgia 110
- 990 Godley Ave
- 511 W 10th St
- 1000 Bedell Ave
- 8150 U S 17
- 705 Bedell Ave
- 104 E 7th St
- 203 E 5th St
- 500 Georgia Ave
- 300 Crestview Dr
- 125 Settlers Trail
- LOT 125 Settlers Trail
- LOT 127 Settlers Trail
- LOT 41 Thoroughbred Rd
- LOT 1 Thoroughbred Rd
- 00 Canoe Run
- 0 Canoe Run Unit 1656405
- 0 Canoe Run Unit 10594952
- 0 Canoe Run Unit 10594949
- 0 Canoe Run Unit 10577672
- 0 Plantation Point Rd Unit 8490615
- 0 Plantation Point Rd Unit 3126235
- 0 Plantation Point Rd
- 307 Plantation Point
- 288 Plantation Point
- 405 Plantation Point
- 197 Hickory Ridge Ct E
- 462 Plantation Point
- 462 Plantation Point Rd
- 228 Plantation Point
- 228 Plantation Point Rd
- 408 Pine Bluff Ct
- 475 Plantation Point Rd
- 475 Plantation Point
- 188 Hickory Ridge Ct E
- 217 Plantation Point Rd
- 321 Jenkins Ln
- 217 Plantation Point
- 504 Plantation Point Rd
- 504 Plantation Point