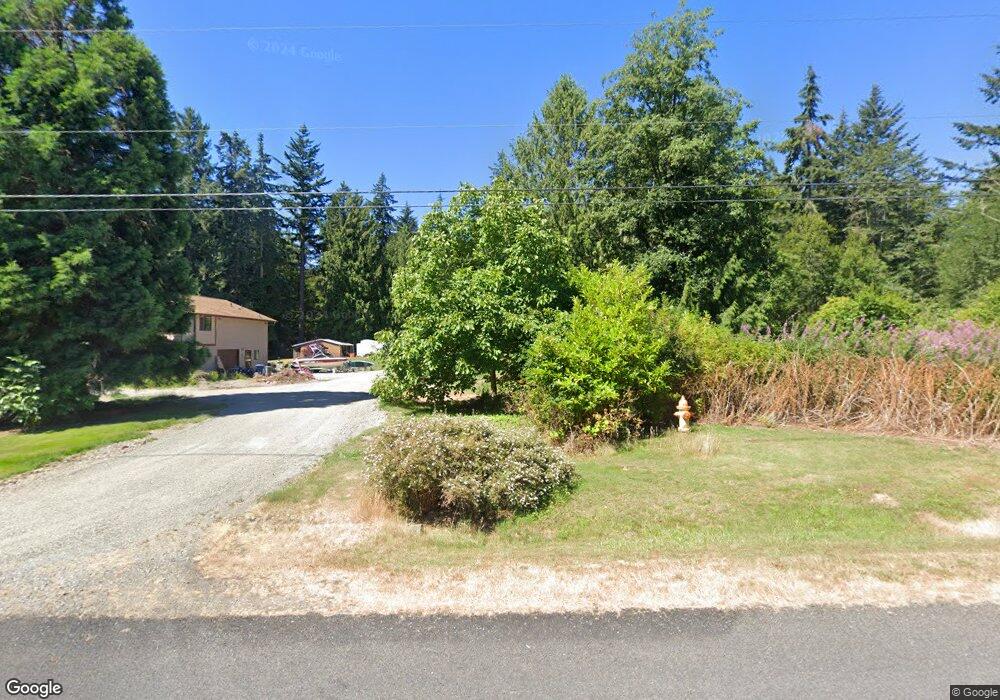
350 Rocky Mountain High Rd Camano Island, WA 98282
Estimated Value: $693,839 - $768,000
2
Beds
3
Baths
1,781
Sq Ft
$407/Sq Ft
Est. Value
About This Home
This home is located at 350 Rocky Mountain High Rd, Camano Island, WA 98282 and is currently estimated at $725,210, approximately $407 per square foot. 350 Rocky Mountain High Rd is a home located in Island County with nearby schools including Utsalady Elementary School, Port Susan Middle School, and Stanwood High School.
Ownership History
Date
Name
Owned For
Owner Type
Purchase Details
Closed on
Oct 18, 2022
Sold by
Miller Christopher A and Miller Jamie M
Bought by
Wyllys Lindsee Christina and Wyllys Donald William
Current Estimated Value
Home Financials for this Owner
Home Financials are based on the most recent Mortgage that was taken out on this home.
Original Mortgage
$488,000
Outstanding Balance
$471,650
Interest Rate
6.7%
Mortgage Type
New Conventional
Estimated Equity
$253,560
Purchase Details
Closed on
Apr 12, 2018
Sold by
Vanpoucks Debra and The Estate Of Sharon Veron
Bought by
Miller Christopher A and Miller Jamie M
Home Financials for this Owner
Home Financials are based on the most recent Mortgage that was taken out on this home.
Original Mortgage
$427,400
Interest Rate
4.43%
Mortgage Type
VA
Purchase Details
Closed on
Oct 26, 2006
Sold by
Vernon Sharon and Estate Of Edward B Vernon
Bought by
Vernon Sharon
Create a Home Valuation Report for This Property
The Home Valuation Report is an in-depth analysis detailing your home's value as well as a comparison with similar homes in the area
Home Values in the Area
Average Home Value in this Area
Purchase History
| Date | Buyer | Sale Price | Title Company |
|---|---|---|---|
| Wyllys Lindsee Christina | -- | Chicago Title | |
| Miller Christopher A | $427,400 | Premier Title Of Island Coun | |
| Vernon Sharon | -- | None Available |
Source: Public Records
Mortgage History
| Date | Status | Borrower | Loan Amount |
|---|---|---|---|
| Open | Wyllys Lindsee Christina | $488,000 | |
| Previous Owner | Miller Christopher A | $427,400 |
Source: Public Records
Tax History Compared to Growth
Tax History
| Year | Tax Paid | Tax Assessment Tax Assessment Total Assessment is a certain percentage of the fair market value that is determined by local assessors to be the total taxable value of land and additions on the property. | Land | Improvement |
|---|---|---|---|---|
| 2024 | $4,838 | $635,208 | $300,000 | $335,208 |
| 2023 | $4,838 | $629,492 | $290,000 | $339,492 |
| 2022 | $4,255 | $601,284 | $290,000 | $311,284 |
| 2021 | $4,037 | $457,311 | $190,000 | $267,311 |
| 2020 | $4,100 | $420,444 | $160,000 | $260,444 |
| 2019 | $3,569 | $421,849 | $230,000 | $191,849 |
| 2018 | $3,270 | $367,440 | $175,000 | $192,440 |
| 2017 | $665 | $311,429 | $150,000 | $161,429 |
| 2016 | $664 | $288,612 | $125,000 | $163,612 |
| 2015 | $689 | $272,299 | $125,000 | $147,299 |
| 2013 | -- | $263,516 | $112,000 | $151,516 |
Source: Public Records
Map
Nearby Homes
- 230 Rocky Mountain High Rd
- 501 S Vesper Way
- 446 Lehman Dr
- 169 Driftwood Shores Rd
- 289 E Driftwood Shores Rd
- 244 David St
- 245 David St
- 0 xxxb S Dove Dr
- 304 S Dove Dr
- 0 xxxa S Dove Dr
- 881 Lawson Rd
- 0 E Shumway Rd
- 979 Cavalero Rd
- 1005 Cavalero Rd
- 695 Blacktail Ln
- 67 Gilbertson Rd
- 945 Rowe Rd
- 596 Forrest Way
- 230 Heather Dr
- 522 Chapman Rd
- 360 Rocky Mountain High Rd
- 42 Rocky Mountain High Rd
- 351 Rocky Mountain High Rd
- 370 Rocky Mountain High Rd
- 333 Rocky Mountain High Rd
- 350 Mountain Crest Ct
- 365 Rocky Mountain High Rd
- 314 Mountain Crest Ct
- 375 Rocky Mountain High Rd
- 380 Rocky Mountain High Rd
- 385 Rocky Mountain High Rd
- 298 Rocky Mountain High Rd
- 303 Rocky Mountain High Rd
- 411 Rocky Mountain High Rd
- 287 Rocky Mountain High Rd
- 284 Rocky Mountain High Rd
- 45 W Camano Hill Rd
- 1 Camano Hill Rd
- 4 Lot 5 Lucy Ct
- 122 Chase Way