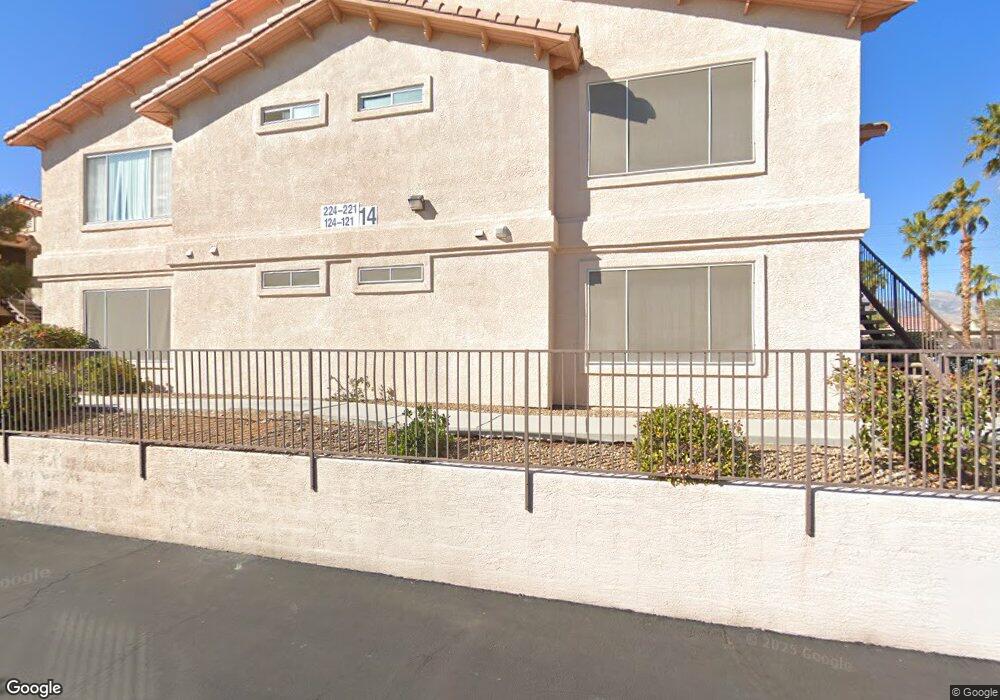
350 S Durango Dr Unit 214 Las Vegas, NV 89145
Angel Park NeighborhoodEstimated Value: $223,000 - $230,491
2
Beds
2
Baths
1,016
Sq Ft
$224/Sq Ft
Est. Value
About This Home
This home is located at 350 S Durango Dr Unit 214, Las Vegas, NV 89145 and is currently estimated at $227,373, approximately $223 per square foot. 350 S Durango Dr Unit 214 is a home located in Clark County with nearby schools including Walter Jacobson Elementary School, Walter Johnson Junior High School Academy of International Studies, and Bonanza High School.
Ownership History
Date
Name
Owned For
Owner Type
Purchase Details
Closed on
Apr 3, 2023
Sold by
Sullivan Andrew D
Bought by
Sullivan Andrew Dominic and Gibson Hillard Dud
Current Estimated Value
Purchase Details
Closed on
Nov 17, 2001
Sold by
Pye Harold
Bought by
Sullivan Andrew D
Home Financials for this Owner
Home Financials are based on the most recent Mortgage that was taken out on this home.
Original Mortgage
$85,170
Interest Rate
6.84%
Mortgage Type
VA
Purchase Details
Closed on
May 17, 2001
Sold by
Lusthoff Kristen L
Bought by
Pye Harold and The Harold & Catherine B Pye Trust 1989
Purchase Details
Closed on
Dec 2, 1999
Sold by
Pye Harold
Bought by
Lusthoff Kristen L
Home Financials for this Owner
Home Financials are based on the most recent Mortgage that was taken out on this home.
Original Mortgage
$58,100
Interest Rate
9.99%
Create a Home Valuation Report for This Property
The Home Valuation Report is an in-depth analysis detailing your home's value as well as a comparison with similar homes in the area
Home Values in the Area
Average Home Value in this Area
Purchase History
| Date | Buyer | Sale Price | Title Company |
|---|---|---|---|
| Sullivan Andrew Dominic | -- | -- | |
| Sullivan Andrew D | $83,200 | Old Republic Title Company | |
| Pye Harold | $31,336 | Nevada Title Company | |
| Lusthoff Kristen L | $83,000 | First American Title Co |
Source: Public Records
Mortgage History
| Date | Status | Borrower | Loan Amount |
|---|---|---|---|
| Previous Owner | Sullivan Andrew D | $85,170 | |
| Previous Owner | Lusthoff Kristen L | $58,100 | |
| Closed | Lusthoff Kristen L | $24,900 |
Source: Public Records
Tax History Compared to Growth
Tax History
| Year | Tax Paid | Tax Assessment Tax Assessment Total Assessment is a certain percentage of the fair market value that is determined by local assessors to be the total taxable value of land and additions on the property. | Land | Improvement |
|---|---|---|---|---|
| 2025 | $726 | $46,577 | $19,950 | $26,627 |
| 2024 | $706 | $46,577 | $19,950 | $26,627 |
| 2023 | $706 | $45,617 | $21,000 | $24,617 |
| 2022 | $685 | $40,969 | $18,200 | $22,769 |
| 2021 | $665 | $39,646 | $17,500 | $22,146 |
| 2020 | $643 | $39,534 | $17,500 | $22,034 |
| 2019 | $635 | $36,981 | $15,050 | $21,931 |
| 2018 | $606 | $29,468 | $8,050 | $21,418 |
| 2017 | $950 | $28,970 | $7,000 | $21,970 |
| 2016 | $569 | $26,056 | $5,250 | $20,806 |
| 2015 | $566 | $21,681 | $4,200 | $17,481 |
| 2014 | $550 | $17,337 | $4,375 | $12,962 |
Source: Public Records
Map
Nearby Homes
- 350 S Durango Dr Unit 108
- 332 Dockside Ct
- 8450 Alta Dr Unit 121
- 8537 Highland View Ave
- 8541 Highland View Ave
- 8425 Running Deer Ave Unit 104
- 8417 Running Deer Ave Unit 101
- 8409 Running Deer Ave Unit 104
- 8325 Alta Dr
- 508 Indian Princess Dr Unit 102
- 8233 Ducharme Ave
- 8616 Crest Hill Ave
- 525 Indian Princess Dr Unit 101
- 525 Indian Princess Dr Unit 204
- 8229 Ducharme Ave
- 8612 Blissville Ave
- 8400 White Eagle Ave Unit 203
- 8220 Abercrombe Way
- 8640 Blissville Ave
- 8452 Boseck Dr Unit 208
- 350 S Durango Dr Unit 207
- 350 S Durango Dr Unit 211
- 350 S Durango Dr Unit 123
- 350 S Durango Dr Unit 209
- 350 S Durango Dr Unit 224
- 350 S Durango Dr Unit 132
- 350 S Durango Dr Unit 133
- 350 S Durango Dr Unit 131
- 350 S Durango Dr Unit 102
- 350 S Durango Dr Unit 202
- 350 S Durango Dr Unit 107
- 350 S Durango Dr Unit 213
- 350 S Durango Dr Unit 203
- 350 S Durango Dr Unit 111
- 350 S Durango Dr Unit 215
- 350 S Durango Dr Unit 223
- 350 S Durango Dr Unit 222
- 350 S Durango Dr Unit 120
- 350 S Durango Dr Unit 130
- 350 S Durango Dr Unit 230