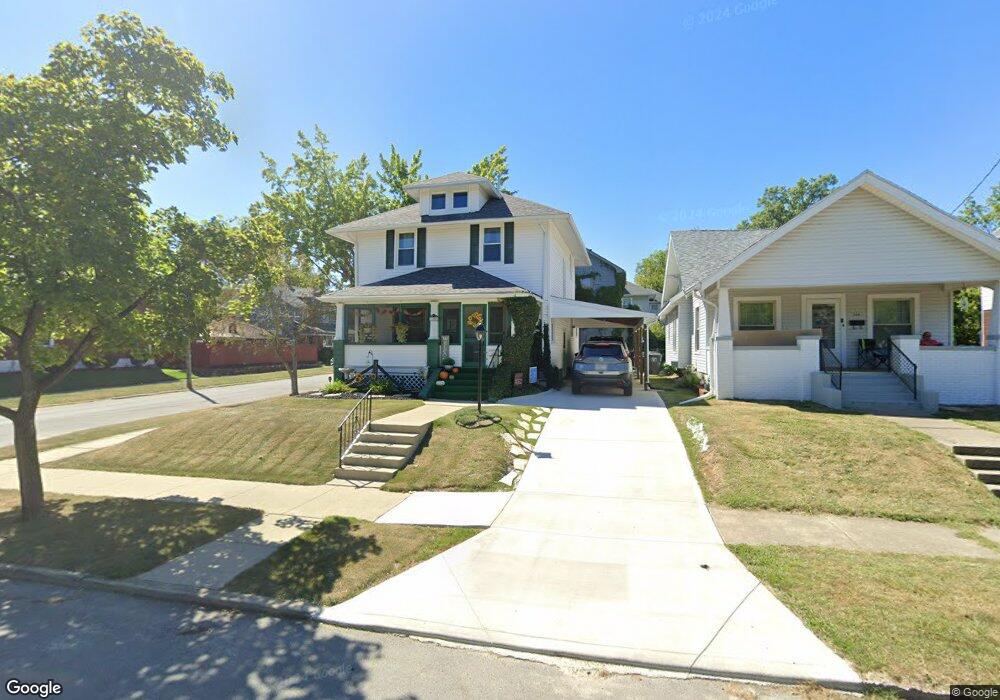
350 S Jameson Ave Lima, OH 45805
Riverside North NeighborhoodEstimated Value: $112,000 - $146,000
3
Beds
2
Baths
1,451
Sq Ft
$92/Sq Ft
Est. Value
About This Home
This home is located at 350 S Jameson Ave, Lima, OH 45805 and is currently estimated at $133,392, approximately $91 per square foot. 350 S Jameson Ave is a home located in Allen County with nearby schools including Heritage Elementary School, Lima West Middle School, and Lima North Middle School.
Ownership History
Date
Name
Owned For
Owner Type
Purchase Details
Closed on
Jul 19, 2023
Sold by
Factor Joanna J and Factor Randall
Bought by
Factor Randall and Factor Joanna J
Current Estimated Value
Purchase Details
Closed on
Oct 24, 2000
Sold by
Factor Randall
Bought by
Wince Joanna J
Home Financials for this Owner
Home Financials are based on the most recent Mortgage that was taken out on this home.
Original Mortgage
$60,501
Interest Rate
7.96%
Mortgage Type
FHA
Purchase Details
Closed on
Sep 19, 1997
Sold by
Pauff Matthew
Bought by
Factor Randall
Home Financials for this Owner
Home Financials are based on the most recent Mortgage that was taken out on this home.
Original Mortgage
$53,500
Interest Rate
7.55%
Mortgage Type
New Conventional
Purchase Details
Closed on
Feb 19, 1993
Sold by
Lagrande Phyllis M
Bought by
Pauff Matthew J and Pauff Kari A
Purchase Details
Closed on
Sep 1, 1978
Bought by
Lagrande Phyllis M
Create a Home Valuation Report for This Property
The Home Valuation Report is an in-depth analysis detailing your home's value as well as a comparison with similar homes in the area
Home Values in the Area
Average Home Value in this Area
Purchase History
| Date | Buyer | Sale Price | Title Company |
|---|---|---|---|
| Factor Randall | -- | None Listed On Document | |
| Wince Joanna J | $61,000 | -- | |
| Factor Randall | $53,500 | -- | |
| Pauff Matthew J | $40,000 | -- | |
| Lagrande Phyllis M | $27,000 | -- |
Source: Public Records
Mortgage History
| Date | Status | Borrower | Loan Amount |
|---|---|---|---|
| Previous Owner | Wince Joanna J | $60,501 | |
| Previous Owner | Factor Randall | $53,500 |
Source: Public Records
Tax History Compared to Growth
Tax History
| Year | Tax Paid | Tax Assessment Tax Assessment Total Assessment is a certain percentage of the fair market value that is determined by local assessors to be the total taxable value of land and additions on the property. | Land | Improvement |
|---|---|---|---|---|
| 2024 | $1,400 | $39,170 | $2,630 | $36,540 |
| 2023 | $1,307 | $31,860 | $2,140 | $29,720 |
| 2022 | $1,314 | $31,860 | $2,140 | $29,720 |
| 2021 | $1,395 | $31,860 | $2,140 | $29,720 |
| 2020 | $1,321 | $26,640 | $2,030 | $24,610 |
| 2019 | $1,321 | $26,640 | $2,030 | $24,610 |
| 2018 | $1,263 | $26,640 | $2,030 | $24,610 |
| 2017 | $1,220 | $24,400 | $2,030 | $22,370 |
| 2016 | $1,236 | $24,400 | $2,030 | $22,370 |
| 2015 | $1,093 | $24,400 | $2,030 | $22,370 |
| 2014 | $1,093 | $21,080 | $2,140 | $18,940 |
| 2013 | $1,064 | $21,080 | $2,140 | $18,940 |
Source: Public Records
Map
Nearby Homes
- 343 S Charles St
- 233 S Kenilworth Ave
- 427 S Kenilworth Ave
- 419 S Collett St
- 1036 W High St
- 705 W Elm St
- 426 S Baxter St
- 120 S Woodlawn Ave
- 1524 Wendell Ave
- 644 S Judkins Ave
- 1459 W Market St
- 1909 Wales Ave
- 711 W Kibby St
- 1120 Richie Ave
- 1517 Allentown Rd
- 2191 Lakewood Ave
- 618 Woodward Ave
- 745 Brice Ave
- 720 S Metcalf St
- 1630 W Market St
- 348 S Jameson Ave
- 922 W State St
- 346 S Jameson Ave
- 402 S Jameson Ave
- 925 W State St
- 336 S Jameson Ave
- 351 S Jameson Ave
- 349 S Jameson Ave
- 334 S Jameson Ave
- 401 S Jameson Ave
- 343 S Jameson Ave
- 412 S Jameson Ave
- 927 W State St
- 405 S Jameson Ave
- 828 W State St
- 351 Lincoln Ave
- 349 Lincoln Ave
- 339 S Jameson Ave