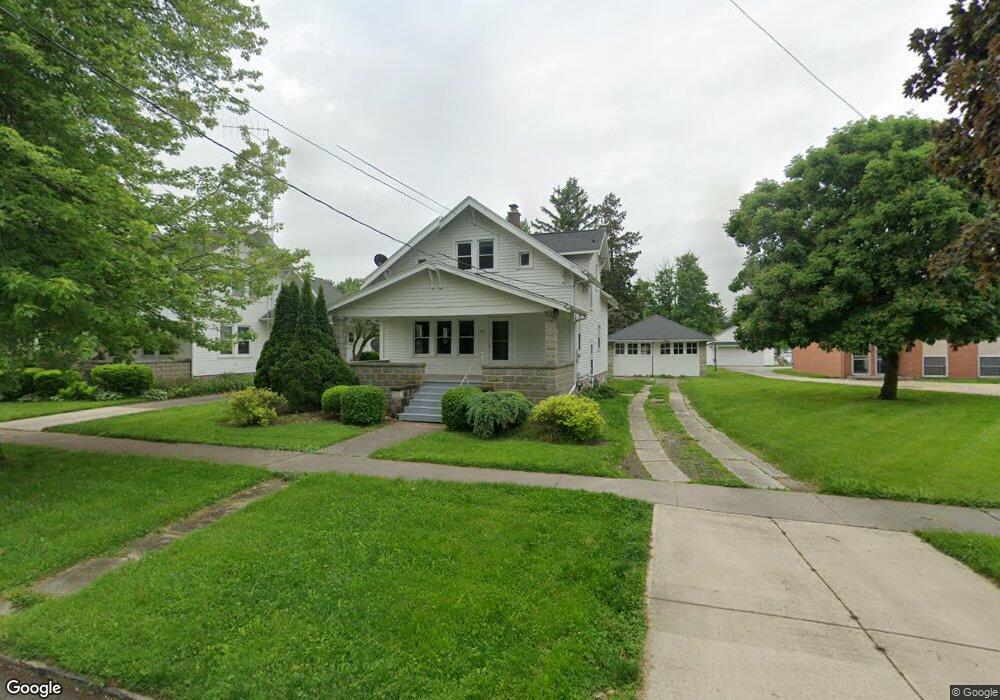
350 Toledo St Elmore, OH 43416
Estimated Value: $144,000 - $189,000
4
Beds
1
Bath
1,512
Sq Ft
$109/Sq Ft
Est. Value
About This Home
This home is located at 350 Toledo St, Elmore, OH 43416 and is currently estimated at $164,468, approximately $108 per square foot. 350 Toledo St is a home located in Ottawa County with nearby schools including Woodmore Elementary School, Woodmore Middle School, and Solomon Lutheran School.
Ownership History
Date
Name
Owned For
Owner Type
Purchase Details
Closed on
May 31, 2024
Sold by
Bockbrader Paul and Bockbrader Scott
Bought by
Jackson Nathan and Jackson Abigail
Current Estimated Value
Purchase Details
Closed on
Sep 8, 2017
Sold by
Bockbrader Mary Jean and Bockbrader Thomas Lee
Bought by
Bockbrader Mary Jean
Purchase Details
Closed on
Dec 13, 2012
Sold by
Bockbrader Thomas L and Bockbrader Mary Jean
Bought by
Bockbrader Thomas L and Bockbrader Mary Jean
Purchase Details
Closed on
May 27, 1994
Sold by
Croll Harold
Bought by
Bockbrader Thomas
Create a Home Valuation Report for This Property
The Home Valuation Report is an in-depth analysis detailing your home's value as well as a comparison with similar homes in the area
Home Values in the Area
Average Home Value in this Area
Purchase History
| Date | Buyer | Sale Price | Title Company |
|---|---|---|---|
| Jackson Nathan | $140,000 | Buckeye Title | |
| Jackson Nathan | $140,000 | Buckeye Title | |
| Bockbrader Mary Jean | -- | None Available | |
| Bockbrader Thomas L | -- | Attorney | |
| Bockbrader Thomas | $45,500 | -- |
Source: Public Records
Tax History Compared to Growth
Tax History
| Year | Tax Paid | Tax Assessment Tax Assessment Total Assessment is a certain percentage of the fair market value that is determined by local assessors to be the total taxable value of land and additions on the property. | Land | Improvement |
|---|---|---|---|---|
| 2024 | $2,053 | $37,709 | $9,821 | $27,888 |
| 2023 | $2,053 | $31,739 | $7,277 | $24,462 |
| 2022 | $1,860 | $31,738 | $7,276 | $24,462 |
| 2021 | $1,874 | $31,740 | $7,280 | $24,460 |
| 2020 | $1,745 | $28,030 | $7,280 | $20,750 |
| 2019 | $1,725 | $28,030 | $7,280 | $20,750 |
| 2018 | $1,705 | $28,030 | $7,280 | $20,750 |
| 2017 | $1,622 | $26,500 | $7,280 | $19,220 |
| 2016 | $1,586 | $26,500 | $7,280 | $19,220 |
| 2015 | $1,686 | $26,500 | $7,280 | $19,220 |
| 2014 | $834 | $25,460 | $7,280 | $18,180 |
| 2013 | $1,672 | $25,460 | $7,280 | $18,180 |
Source: Public Records
Map
Nearby Homes
- 0 W Portage River Rd S Unit 6130453
- 19383 Courtland Ave
- 20240 W Portage River South Rd
- 6201 County Highway 165
- 212 S Perry St
- 219 Lime St
- 612 W Main St
- 2574 County Road 74
- 739 Riverside Dr
- 421 Parklane Dr
- 205 W 4th St
- 571 Parklane Dr
- 514 West St
- 904 Main St
- 207 E 11th St
- 14878 W State Route 163
- 1350 N Genoa Clay Center Rd
- 510 Wilson St
- 1861 N Opfer-Lentz Rd
- 1301 West St