
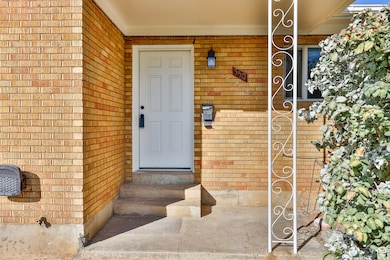
350 W 2575 N Clearfield, UT 84015
Estimated payment $2,593/month
Highlights
- Second Kitchen
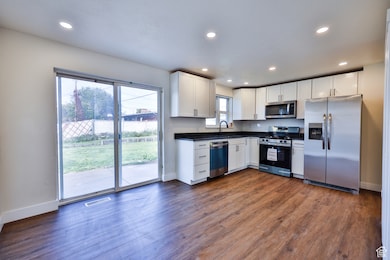
- Updated Kitchen
- Main Floor Primary Bedroom
- RV or Boat Parking
- Rambler Architecture
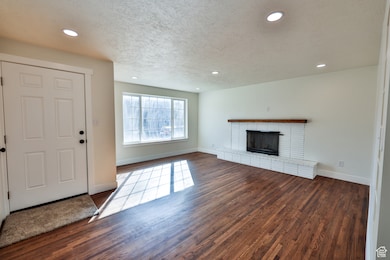
- 1 Fireplace
About This Home
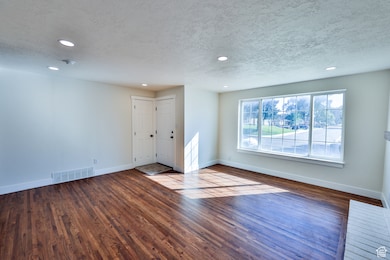
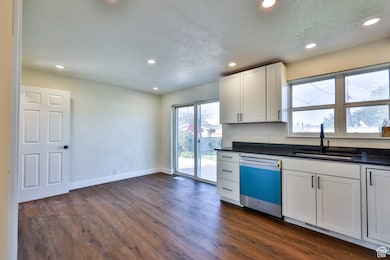
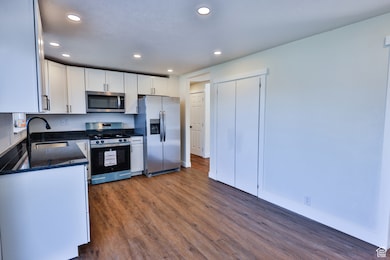
This beautifully remodeled Sunset rambler is a great investment! On the main floor, you'll find a large living room, brand new kitchen complete with stainless steel appliances, 3 bedrooms including the primary bd with walk-in shower, a full bathroom in the hallway, and stackable washer/dryer. The basement can be an extension of the home, making it a 5-bd house with 2 kitchens and 2 laundrys, OR it's set up as a spacious 2-bedroom apartment that can be entered separately from the 1 car garage. It has also been completely renovated with new kitchen, bathroom, and flooring. All bathrooms have beautiful custom tilework. Enjoy your spacious backyard, plenty of parking, and you're just a short distance to local parks, dining, and freeway access. All information provided as a courtesy only. Buyer/buyer's agent to verify all info.
Home Details
Home Type
- Single Family
Est. Annual Taxes
- $2,050
Year Built
- Built in 1960
Lot Details
- 8,712 Sq Ft Lot
- Partially Fenced Property
- Landscaped
- Property is zoned Single-Family
Parking
- 1 Car Attached Garage
- 4 Open Parking Spaces
- RV or Boat Parking
Home Design
- Rambler Architecture
- Brick Exterior Construction
Interior Spaces
- 2,364 Sq Ft Home
- 2-Story Property
- 1 Fireplace
- Sliding Doors
- Carpet
Kitchen
- Updated Kitchen
- Second Kitchen
- Free-Standing Range
- Microwave
- Disposal
Bedrooms and Bathrooms
- 5 Bedrooms | 3 Main Level Bedrooms
- Primary Bedroom on Main
Laundry
- Dryer
- Washer
Basement
- Basement Fills Entire Space Under The House
- Apartment Living Space in Basement
Outdoor Features
- Open Patio
Schools
- Sunset Elementary And Middle School
- Northridge High School
Utilities
- Forced Air Heating and Cooling System
- Natural Gas Connected
Community Details
- No Home Owners Association
Listing and Financial Details
- Assessor Parcel Number 13-064-0052
Map
Home Values in the Area
Average Home Value in this Area
Tax History
| Year | Tax Paid | Tax Assessment Tax Assessment Total Assessment is a certain percentage of the fair market value that is determined by local assessors to be the total taxable value of land and additions on the property. | Land | Improvement |
|---|---|---|---|---|
| 2025 | $2,255 | $205,700 | $74,433 | $131,267 |
| 2024 | $2,050 | $187,000 | $71,145 | $115,855 |
| 2023 | $342 | $321,000 | $113,639 | $207,361 |
| 2022 | $500 | $185,900 | $64,980 | $120,920 |
| 2021 | $1,781 | $252,000 | $70,041 | $181,959 |
| 2020 | $1,567 | $218,000 | $59,102 | $158,898 |
| 2019 | $1,464 | $209,000 | $75,027 | $133,973 |
| 2018 | $1,303 | $182,000 | $59,958 | $122,042 |
| 2016 | $1,086 | $77,935 | $28,351 | $49,584 |
| 2015 | $1,033 | $70,235 | $28,351 | $41,884 |
| 2014 | $974 | $67,683 | $28,539 | $39,144 |
| 2013 | -- | $68,484 | $23,265 | $45,219 |
Property History
| Date | Event | Price | List to Sale | Price per Sq Ft |
|---|---|---|---|---|
| 11/27/2025 11/27/25 | For Rent | $1,395 | +134.5% | -- |
| 11/16/2025 11/16/25 | Price Changed | $595 | -14.4% | $0 / Sq Ft |
| 11/16/2025 11/16/25 | Price Changed | $695 | -50.2% | $1 / Sq Ft |
| 11/07/2025 11/07/25 | Off Market | $1,395 | -- | -- |
| 11/01/2025 11/01/25 | For Rent | $700 | -12.5% | -- |
| 11/01/2025 11/01/25 | For Rent | $800 | -42.7% | -- |
| 10/31/2025 10/31/25 | For Rent | $1,395 | 0.0% | -- |
| 10/27/2025 10/27/25 | Pending | -- | -- | -- |
| 10/22/2025 10/22/25 | For Sale | $459,900 | -- | $195 / Sq Ft |
Purchase History
| Date | Type | Sale Price | Title Company |
|---|---|---|---|
| Warranty Deed | -- | Rei Title Utah Llc | |
| Warranty Deed | -- | Rei Title Utah Llc | |
| Warranty Deed | -- | Metro National Title |
Mortgage History
| Date | Status | Loan Amount | Loan Type |
|---|---|---|---|
| Previous Owner | $240,000 | New Conventional | |
| Closed | $0 | Purchase Money Mortgage |
Source: UtahRealEstate.com
MLS Number: 2118788
APN: 13-064-0052
Disclaimer: Certain information contained herein is derived from information provided by parties other than Homes.com. All information provided is deemed reliable, but is not guaranteed to be accurate and should be independently verified.
![]() IDX information is provided exclusively for consumers’ personal, non-commercial use, that it may not be used for any purpose other than to identify prospective properties consumers may be interested in purchasing, and that the data is deemed reliable but is not guaranteed accurate by the MLS. Licensor is only providing the MLS Content and not other sources of data provided in the Product.
IDX information is provided exclusively for consumers’ personal, non-commercial use, that it may not be used for any purpose other than to identify prospective properties consumers may be interested in purchasing, and that the data is deemed reliable but is not guaranteed accurate by the MLS. Licensor is only providing the MLS Content and not other sources of data provided in the Product.
Based on information from the Wasatch Front Regional Multiple Listing Service, Inc.. All data, including all measurements and calculations of area, is obtained from various sources and has not been, and will not be, verified by broker or the MLS. All information should be independently reviewed and verified for accuracy. Properties may or may not be listed by the office/agent presenting the information.
