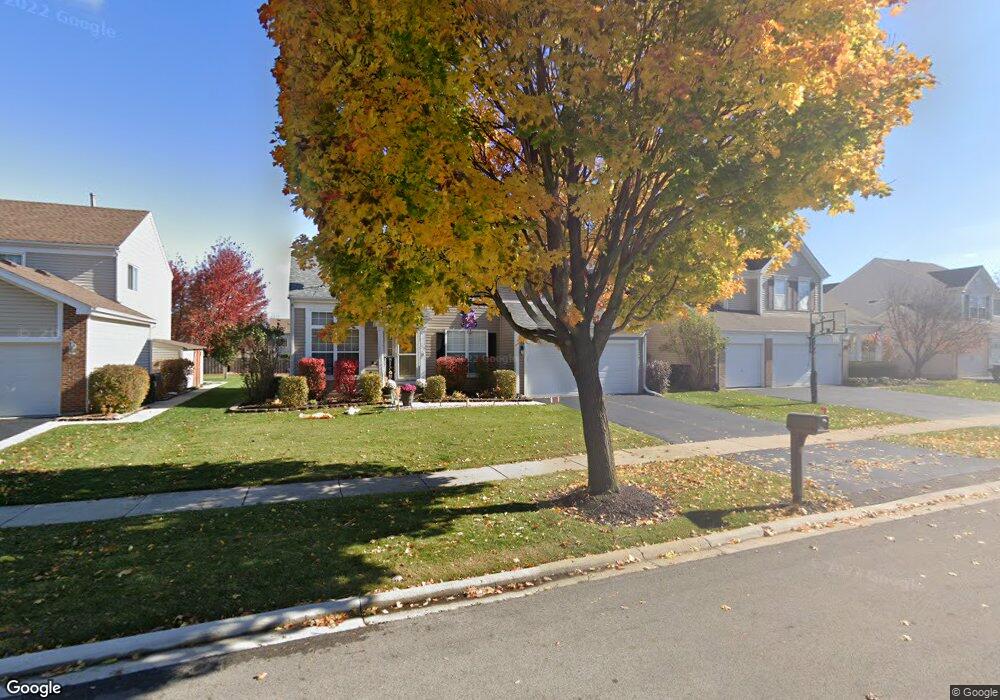
350 Windermere Way Lake In the Hills, IL 60156
Estimated Value: $356,405 - $404,000
--
Bed
--
Bath
1,628
Sq Ft
$236/Sq Ft
Est. Value
About This Home
This home is located at 350 Windermere Way, Lake In the Hills, IL 60156 and is currently estimated at $384,601, approximately $236 per square foot. 350 Windermere Way is a home located in McHenry County with nearby schools including Martin Elementary School, Chesak Elementary School, and Marlowe Middle School.
Ownership History
Date
Name
Owned For
Owner Type
Purchase Details
Closed on
Jan 7, 2003
Sold by
Derbas Christopher
Bought by
Derbas Christopher and Derbas Tracy
Current Estimated Value
Home Financials for this Owner
Home Financials are based on the most recent Mortgage that was taken out on this home.
Original Mortgage
$144,000
Outstanding Balance
$56,266
Interest Rate
4.87%
Estimated Equity
$328,335
Purchase Details
Closed on
Oct 25, 2000
Sold by
Opolony James W and Opolony Susan M
Bought by
Derbas Christopher
Home Financials for this Owner
Home Financials are based on the most recent Mortgage that was taken out on this home.
Original Mortgage
$142,000
Interest Rate
7.65%
Purchase Details
Closed on
Dec 28, 1994
Sold by
Sundance Kaco Ltd Partnership
Bought by
Opolony James W and Opolony Susan M
Home Financials for this Owner
Home Financials are based on the most recent Mortgage that was taken out on this home.
Original Mortgage
$135,700
Interest Rate
9.24%
Create a Home Valuation Report for This Property
The Home Valuation Report is an in-depth analysis detailing your home's value as well as a comparison with similar homes in the area
Home Values in the Area
Average Home Value in this Area
Purchase History
| Date | Buyer | Sale Price | Title Company |
|---|---|---|---|
| Derbas Christopher | -- | Metropolitan Title Co | |
| Derbas Christopher | $177,000 | -- | |
| Opolony James W | $153,500 | Ticor Title |
Source: Public Records
Mortgage History
| Date | Status | Borrower | Loan Amount |
|---|---|---|---|
| Open | Derbas Christopher | $144,000 | |
| Closed | Derbas Christopher | $142,000 | |
| Previous Owner | Opolony James W | $135,700 |
Source: Public Records
Tax History Compared to Growth
Tax History
| Year | Tax Paid | Tax Assessment Tax Assessment Total Assessment is a certain percentage of the fair market value that is determined by local assessors to be the total taxable value of land and additions on the property. | Land | Improvement |
|---|---|---|---|---|
| 2024 | $6,983 | $102,613 | $6,989 | $95,624 |
| 2023 | $6,787 | $92,178 | $6,278 | $85,900 |
| 2022 | $6,538 | $83,936 | $5,717 | $78,219 |
| 2021 | $6,332 | $79,050 | $5,384 | $73,666 |
| 2020 | $6,245 | $76,941 | $5,240 | $71,701 |
| 2019 | $6,146 | $74,976 | $5,106 | $69,870 |
| 2018 | $5,761 | $69,288 | $5,747 | $63,541 |
| 2017 | $5,643 | $65,298 | $5,416 | $59,882 |
| 2016 | $5,687 | $62,082 | $5,149 | $56,933 |
| 2013 | -- | $61,219 | $12,277 | $48,942 |
Source: Public Records
Map
Nearby Homes
- 390 Windermere Way
- 10117 Dunhill Dr
- 131 S Annandale Dr
- 870 Noelle Bend
- 10549 Wakefield Ln
- 10828 Braemar Pkwy
- 10540 Wakefield Ln Unit 11
- 10967 Braemar Pkwy
- 10631 Oregon Trail
- 8 Litchfield Ct Unit 1
- 2390 Wexford Ln
- 4535 Heron Dr
- 9105 Algonquin Rd
- 9976 Edgebrook Ln
- 9966 Edgebrook Ln
- 9956 Edgebrook Ln
- 9946 Edgebrook Ln
- 11291 Wildridge Ln
- 11290 Wildridge Ln
- 2331 Claremont Ln
- 340 Windermere Way
- 360 Windermere Way
- 330 Windermere Way
- 370 Windermere Way
- 341 Annandale Dr
- 331 Annandale Dr
- 351 Annandale Dr
- 321 Annandale Dr
- 380 Windermere Way
- 320 Windermere Way
- 361 Annandale Dr
- 401 Windermere Way
- 391 Windermere Way
- 411 Windermere Way
- 381 Windermere Way
- 411 Windermere Way
- 311 Annandale Dr
- 310 Windermere Way
- 371 Annandale Dr
- 371 Windermere Way