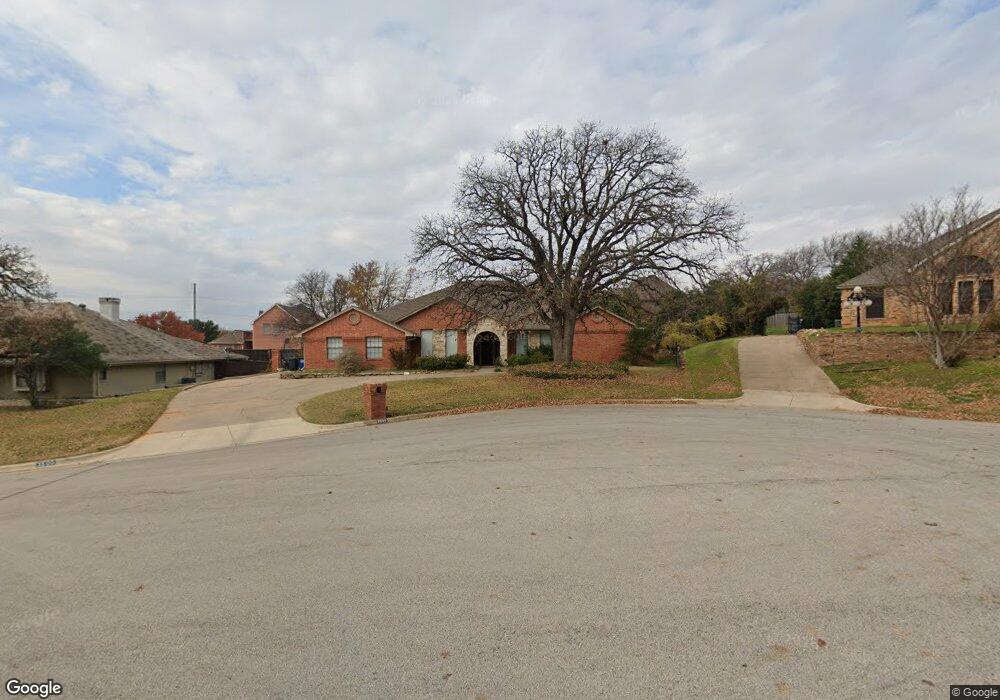
3500 Chapelwood Ct Colleyville, TX 76034
Estimated Value: $787,000 - $983,000
4
Beds
4
Baths
4,899
Sq Ft
$185/Sq Ft
Est. Value
About This Home
This home is located at 3500 Chapelwood Ct, Colleyville, TX 76034 and is currently estimated at $904,129, approximately $184 per square foot. 3500 Chapelwood Ct is a home located in Tarrant County with nearby schools including Bedford Heights Elementary School, Bedford Junior High School, and L.D. Bell High School.
Ownership History
Date
Name
Owned For
Owner Type
Purchase Details
Closed on
Jul 23, 2015
Sold by
Federal National Mortgage Association
Bought by
Livingston David Bradley and Livingston Brandy Renee
Current Estimated Value
Home Financials for this Owner
Home Financials are based on the most recent Mortgage that was taken out on this home.
Original Mortgage
$284,000
Outstanding Balance
$168,215
Interest Rate
4.08%
Mortgage Type
New Conventional
Estimated Equity
$735,914
Purchase Details
Closed on
Jun 4, 2014
Sold by
Nanson Paul D and Nanson Sharon L
Bought by
Federal National Mortgage Association and Fannie Mae
Purchase Details
Closed on
Jul 24, 2001
Sold by
Ge Capital Mtg Services Inc
Bought by
Nanson Paul D and Nanson Sharon L
Home Financials for this Owner
Home Financials are based on the most recent Mortgage that was taken out on this home.
Original Mortgage
$207,000
Interest Rate
7.07%
Purchase Details
Closed on
May 1, 2001
Sold by
James William H and James Sylvia Marlene
Bought by
Ge Capital Mtg Services Inc
Create a Home Valuation Report for This Property
The Home Valuation Report is an in-depth analysis detailing your home's value as well as a comparison with similar homes in the area
Home Values in the Area
Average Home Value in this Area
Purchase History
| Date | Buyer | Sale Price | Title Company |
|---|---|---|---|
| Livingston David Bradley | -- | Independence Title Dfw | |
| Federal National Mortgage Association | $272,123 | None Available | |
| Nanson Paul D | -- | Alamo Title Company | |
| Ge Capital Mtg Services Inc | $292,000 | -- |
Source: Public Records
Mortgage History
| Date | Status | Borrower | Loan Amount |
|---|---|---|---|
| Open | Livingston David Bradley | $284,000 | |
| Previous Owner | Nanson Paul D | $207,000 |
Source: Public Records
Tax History Compared to Growth
Tax History
| Year | Tax Paid | Tax Assessment Tax Assessment Total Assessment is a certain percentage of the fair market value that is determined by local assessors to be the total taxable value of land and additions on the property. | Land | Improvement |
|---|---|---|---|---|
| 2025 | $6,021 | $455,328 | $120,000 | $335,328 |
| 2024 | $6,021 | $511,604 | $120,000 | $391,604 |
| 2023 | $8,420 | $592,125 | $100,000 | $492,125 |
| 2022 | $10,155 | $522,624 | $100,000 | $422,624 |
| 2021 | $9,879 | $472,445 | $100,000 | $372,445 |
| 2020 | $9,160 | $433,000 | $100,000 | $333,000 |
| 2019 | $9,267 | $433,000 | $100,000 | $333,000 |
| 2018 | $6,808 | $385,000 | $100,000 | $285,000 |
| 2017 | $7,986 | $350,000 | $35,000 | $315,000 |
| 2016 | $7,550 | $330,899 | $35,000 | $295,899 |
| 2015 | -- | $339,000 | $35,000 | $304,000 |
| 2014 | -- | $339,000 | $35,000 | $304,000 |
Source: Public Records
Map
Nearby Homes
- 3713 Brentwood Ct
- 404 Heather Ln
- 2620 Brookridge Dr
- 305 Warbler Dr
- 2244 Hurstview Dr
- 2212 Mountainview Dr
- 405 Woodbriar Ct
- 2212 Hurstview Dr
- 320 Blue Quail Ct
- 2732 Woodbridge Dr
- 2668 Bent Tree Dr
- 421 Cavender Ct
- 712 Springwood Dr
- 2804 Ridgewood Dr
- 2844 Hurstview Dr
- 432 Sunnybrook Ct
- 3605 Spring Valley Dr
- 712 Springhill Dr
- 628 Huntwich Dr
- 2809 Sandstone Dr
- 3412 Chapelwood Ct
- 3504 Chapelwood Ct
- 3501 Brentwood Dr
- 3505 Brentwood Dr
- 3411 Brentwood Dr
- 3501 Chapelwood Ct
- 3509 Brentwood Dr
- 3505 Chapelwood Ct
- 3411 Chapelwood Ct
- 3512 Woodcrest Ct
- 3511 Brentwood Dr
- 301 Chapelwood Dr
- 3511 Woodcrest Ct
- 305 Chapelwood Dr
- 221 Chapelwood Dr
- 309 Chapelwood Dr
- 3500 Brentwood Dr
- 3500 Cliffwood Dr
- 3504 Brentwood Dr
- 3504 Cliffwood Dr