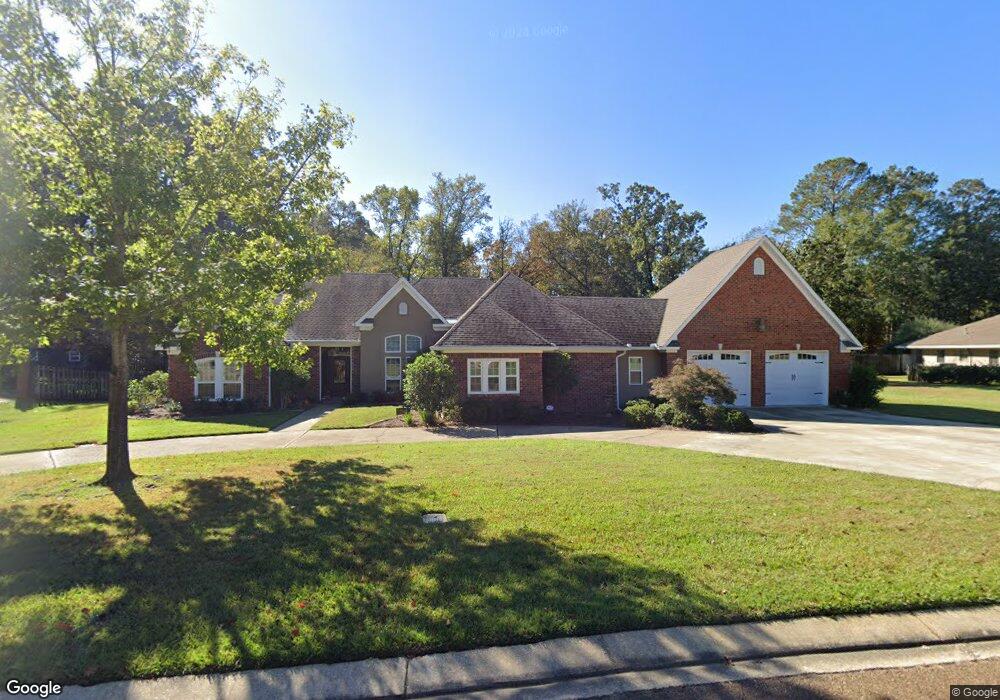
3500 English Turn Ruston, LA 71270
Estimated Value: $404,000 - $713,000
4
Beds
3
Baths
3,416
Sq Ft
$150/Sq Ft
Est. Value
About This Home
This home is located at 3500 English Turn, Ruston, LA 71270 and is currently estimated at $511,141, approximately $149 per square foot. 3500 English Turn is a home located in Lincoln Parish with nearby schools including Hillcrest Elementary School, Ruston Elementary School, and Ruston Junior High School.
Ownership History
Date
Name
Owned For
Owner Type
Purchase Details
Closed on
Jun 30, 2014
Sold by
Clark Jeremy Shane and Clark Shelley Hosea
Bought by
Rogers Holland Samuel and Holland Marsha Jo
Current Estimated Value
Purchase Details
Closed on
Aug 13, 2010
Sold by
Abraham Jacob and Paulose Jacob Jeeva
Bought by
Clark Jeremy Shane and Clark Shelley Hosea
Home Financials for this Owner
Home Financials are based on the most recent Mortgage that was taken out on this home.
Original Mortgage
$236,300
Interest Rate
4.54%
Mortgage Type
New Conventional
Purchase Details
Closed on
Jun 27, 2005
Sold by
Davis H Russell and Davis Kathryn R
Bought by
Abraham Jacob and Paulose Jacob Jeeva
Home Financials for this Owner
Home Financials are based on the most recent Mortgage that was taken out on this home.
Original Mortgage
$242,000
Interest Rate
5.76%
Mortgage Type
Purchase Money Mortgage
Create a Home Valuation Report for This Property
The Home Valuation Report is an in-depth analysis detailing your home's value as well as a comparison with similar homes in the area
Home Values in the Area
Average Home Value in this Area
Purchase History
| Date | Buyer | Sale Price | Title Company |
|---|---|---|---|
| Rogers Holland Samuel | $338,000 | None Available | |
| Clark Jeremy Shane | $278,000 | None Available | |
| Abraham Jacob | $242,000 | None Available |
Source: Public Records
Mortgage History
| Date | Status | Borrower | Loan Amount |
|---|---|---|---|
| Previous Owner | Clark Jeremy Shane | $236,300 | |
| Previous Owner | Abraham Jacob | $242,000 |
Source: Public Records
Tax History Compared to Growth
Tax History
| Year | Tax Paid | Tax Assessment Tax Assessment Total Assessment is a certain percentage of the fair market value that is determined by local assessors to be the total taxable value of land and additions on the property. | Land | Improvement |
|---|---|---|---|---|
| 2024 | $3,086 | $36,156 | $7,215 | $28,941 |
| 2023 | $2,633 | $29,633 | $3,705 | $25,928 |
| 2022 | $2,647 | $29,633 | $3,705 | $25,928 |
| 2021 | $2,450 | $29,633 | $3,705 | $25,928 |
| 2020 | $2,463 | $29,633 | $3,705 | $25,928 |
| 2019 | $2,510 | $30,912 | $3,705 | $27,207 |
| 2018 | $2,442 | $30,912 | $3,705 | $27,207 |
| 2017 | $2,420 | $30,560 | $3,705 | $26,855 |
| 2016 | $2,411 | $0 | $0 | $0 |
| 2015 | $2,348 | $27,335 | $3,135 | $24,200 |
| 2013 | $2,289 | $26,235 | $3,135 | $23,100 |
Source: Public Records
Map
Nearby Homes
- 0 English Turn
- 704 Hundred Oaks Dr
- 3001 Belcara Dr
- 3114 Canal St
- 509 E Kentucky Ave
- 2203 Greenbriar Dr
- 2104 Greenbriar Dr
- 800 Monterey Dr
- 2411 Northwood Dr
- 308 Northwood Place
- 402 E Kentucky Ave
- 1801 Nancy Dr
- 104 Llanfair Dr
- 1729 Farmerville Hwy
- 0 Louisiana 33
- 2420 Highway 33
- 521 Audubon Dr
- 136 N Pinecrest Dr
- 1727 Trade Dr
- 203 Huey Ave
- 3504 English Turn
- 3412 English Turn
- 3501 English Turn
- 3508 English Turn
- 3505 English Turn
- 3408 English Turn
- 3409 English Turn
- 1103 Hunt Ln
- 3005 English Turn
- 2800 Foxxwood Dr
- 3512 English Turn
- 3405 English Turn
- 3009 English Turn
- 3404 English Turn
- 2704 Foxxwood Dr
- 2804 Foxxwood Dr
- 1104 Hunt Ln
- 2702 Foxxwood Dr
- 3000 English Turn
- 3401 English Turn