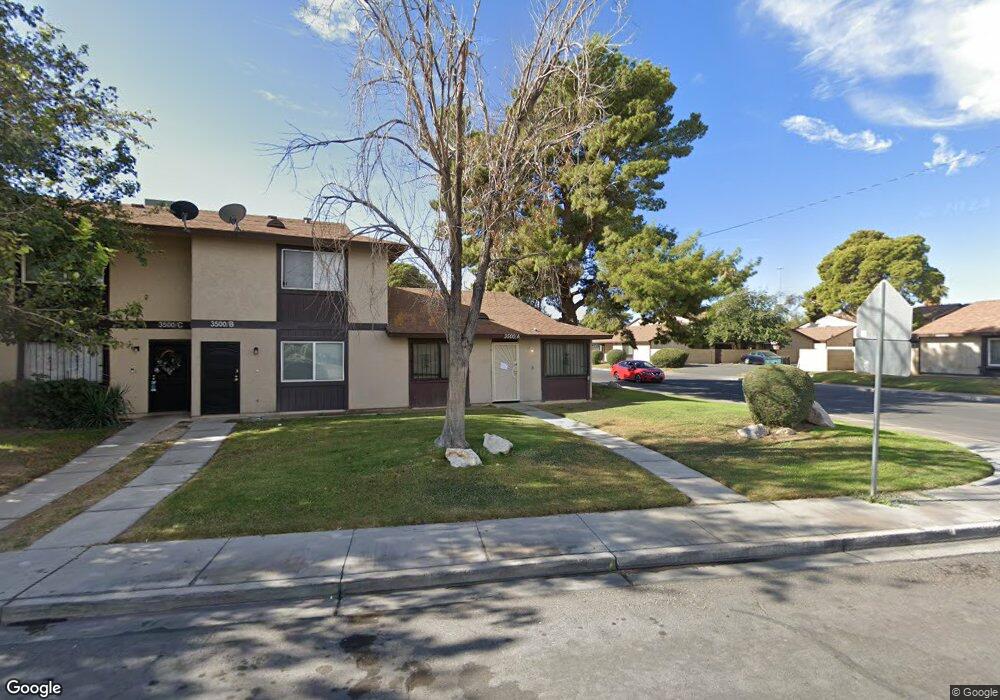
3500 Mercury St Unit D North Las Vegas, NV 89030
Downtown North Las Vegas NeighborhoodEstimated Value: $148,421 - $203,000
2
Beds
2
Baths
936
Sq Ft
$177/Sq Ft
Est. Value
About This Home
This home is located at 3500 Mercury St Unit D, North Las Vegas, NV 89030 and is currently estimated at $165,355, approximately $176 per square foot. 3500 Mercury St Unit D is a home located in Clark County with nearby schools including Lois Craig Elementary School, Marvin M Sedway Middle School, and Canyon Springs High School And The Leadership And.
Ownership History
Date
Name
Owned For
Owner Type
Purchase Details
Closed on
Dec 9, 2003
Sold by
Perez Cecilia
Bought by
Rodriguez Manuel R
Current Estimated Value
Home Financials for this Owner
Home Financials are based on the most recent Mortgage that was taken out on this home.
Original Mortgage
$45,000
Outstanding Balance
$20,746
Interest Rate
5.92%
Mortgage Type
Unknown
Estimated Equity
$144,609
Purchase Details
Closed on
Nov 24, 2003
Sold by
Serraile Leara V
Bought by
Rodriguez Manuel R
Home Financials for this Owner
Home Financials are based on the most recent Mortgage that was taken out on this home.
Original Mortgage
$45,000
Outstanding Balance
$20,746
Interest Rate
5.92%
Mortgage Type
Unknown
Estimated Equity
$144,609
Purchase Details
Closed on
Oct 2, 1996
Sold by
Serraile Leara V
Bought by
Serraile Leara and Leara Serraile Family Trust
Create a Home Valuation Report for This Property
The Home Valuation Report is an in-depth analysis detailing your home's value as well as a comparison with similar homes in the area
Home Values in the Area
Average Home Value in this Area
Purchase History
| Date | Buyer | Sale Price | Title Company |
|---|---|---|---|
| Rodriguez Manuel R | -- | Southwest Title | |
| Rodriguez Manuel R | $50,000 | Southwest Title | |
| Serraile Leara | -- | -- |
Source: Public Records
Mortgage History
| Date | Status | Borrower | Loan Amount |
|---|---|---|---|
| Open | Rodriguez Manuel R | $45,000 |
Source: Public Records
Tax History Compared to Growth
Tax History
| Year | Tax Paid | Tax Assessment Tax Assessment Total Assessment is a certain percentage of the fair market value that is determined by local assessors to be the total taxable value of land and additions on the property. | Land | Improvement |
|---|---|---|---|---|
| 2025 | $371 | $28,210 | $10,850 | $17,360 |
| 2024 | $344 | $28,210 | $10,850 | $17,360 |
| 2023 | $344 | $28,792 | $12,600 | $16,192 |
| 2022 | $319 | $24,736 | $9,100 | $15,636 |
| 2021 | $295 | $22,003 | $9,100 | $12,903 |
| 2020 | $271 | $21,425 | $7,700 | $13,725 |
| 2019 | $254 | $21,485 | $7,700 | $13,785 |
| 2018 | $243 | $17,509 | $4,200 | $13,309 |
| 2017 | $593 | $17,648 | $4,200 | $13,448 |
| 2016 | $229 | $14,211 | $3,850 | $10,361 |
| 2015 | $227 | $8,633 | $2,800 | $5,833 |
| 2014 | $220 | $6,244 | $1,750 | $4,494 |
Source: Public Records
Map
Nearby Homes
- 3500 Mercury St Unit F
- 3500 Mercury St Unit A
- 3420 Mercury St Unit B
- 3420 Mercury St Unit H
- 3417 Civic Center Dr Unit B
- 3535 Mercury St Unit E
- 3412 Mercury St Unit I
- 3523 Mercury St Unit G
- 3505 Mercury St Unit A
- 3505 Mercury St Unit B
- 3505 Mercury St Unit G
- 3405 Civic Center Dr Unit E
- 2112 Sun Ave Unit J
- 2101 Sun Ave
- 3244 Figler Ct
- 3204 Crawford St
- 1806 Renada Cir
- 3008 Saint George St Unit F
- 3008 Saint George St Unit B
- 2528 E Brooks Ave
- 3500 Mercury St Unit C
- 3500 Mercury St Unit H
- 3500 Mercury St Unit G
- 3500 Mercury St Unit E
- 3500 Mercury St Unit B
- 3424 Mercury St Unit E
- 3424 Mercury St Unit D
- 3424 Mercury St Unit B
- 3424 Mercury St Unit A
- 3420 Mercury St Unit F
- 3420 Mercury St Unit E
- 3420 Mercury St Unit G
- 3420 Mercury St Unit D
- 3420 Mercury St Unit A
- 3420 Mercury St Unit C
- 3420 Mercury St Unit I
- 2316 Saturn Ave
- 3533 Mercury St Unit A
- 3533 Mercury St Unit B
- 3533 Mercury St Unit C