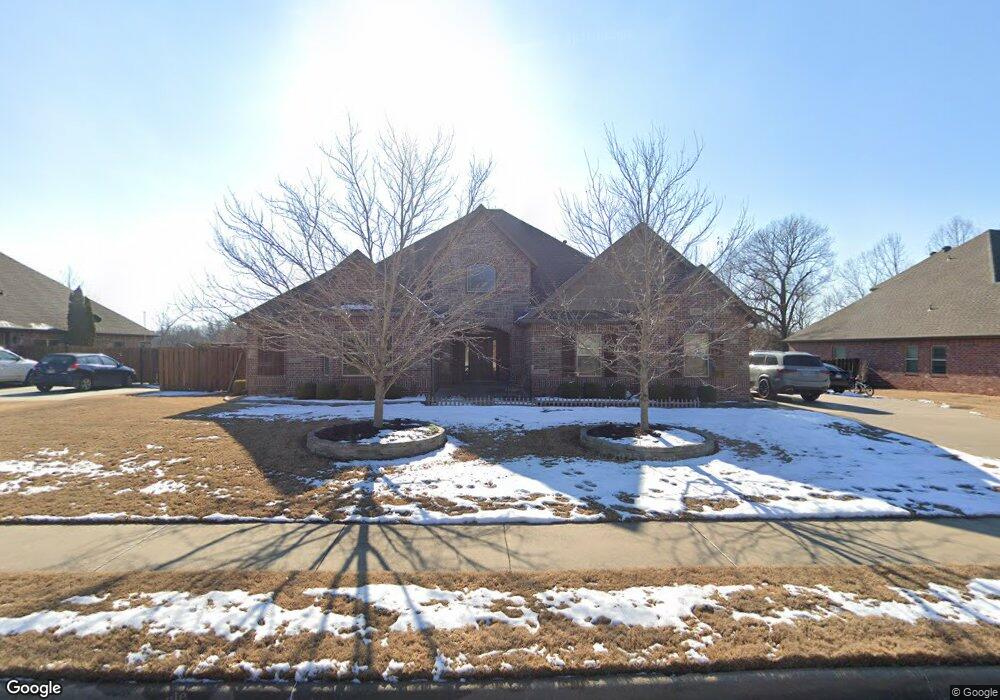
3500 NE Oaktrace Ave Bentonville, AR 72712
Estimated Value: $656,000 - $770,911
4
Beds
5
Baths
3,125
Sq Ft
$234/Sq Ft
Est. Value
About This Home
This home is located at 3500 NE Oaktrace Ave, Bentonville, AR 72712 and is currently estimated at $731,728, approximately $234 per square foot. 3500 NE Oaktrace Ave is a home located in Benton County with nearby schools including Ruth Barker Middle School, Apple Glen Elementary School, and Washington Junior High School.
Ownership History
Date
Name
Owned For
Owner Type
Purchase Details
Closed on
Jun 10, 2020
Sold by
Kumar Macharla Sanjeev and Kumar Srirupa
Bought by
Macharla Sanjeev Kumar and Macharla Srirupa
Current Estimated Value
Home Financials for this Owner
Home Financials are based on the most recent Mortgage that was taken out on this home.
Original Mortgage
$270,000
Outstanding Balance
$238,274
Interest Rate
3.2%
Mortgage Type
New Conventional
Estimated Equity
$493,454
Purchase Details
Closed on
Aug 31, 2011
Sold by
Rojo Llc
Bought by
Macharla Sanjeev Kumar
Home Financials for this Owner
Home Financials are based on the most recent Mortgage that was taken out on this home.
Original Mortgage
$327,607
Interest Rate
4.43%
Mortgage Type
New Conventional
Purchase Details
Closed on
May 9, 2011
Sold by
Idgas Llc
Bought by
Rojo Llc
Create a Home Valuation Report for This Property
The Home Valuation Report is an in-depth analysis detailing your home's value as well as a comparison with similar homes in the area
Home Values in the Area
Average Home Value in this Area
Purchase History
| Date | Buyer | Sale Price | Title Company |
|---|---|---|---|
| Macharla Sanjeev Kumar | -- | Old Republic Title | |
| Macharla Sanjeev Kumar | $345,000 | None Available | |
| Rojo Llc | $60,000 | Rtc |
Source: Public Records
Mortgage History
| Date | Status | Borrower | Loan Amount |
|---|---|---|---|
| Open | Macharla Sanjeev Kumar | $270,000 | |
| Previous Owner | Macharla Sanjeev Kumar | $327,607 |
Source: Public Records
Tax History Compared to Growth
Tax History
| Year | Tax Paid | Tax Assessment Tax Assessment Total Assessment is a certain percentage of the fair market value that is determined by local assessors to be the total taxable value of land and additions on the property. | Land | Improvement |
|---|---|---|---|---|
| 2025 | $5,221 | $119,545 | $19,600 | $99,945 |
| 2024 | $5,006 | $119,545 | $19,600 | $99,945 |
| 2023 | $4,767 | $91,020 | $8,600 | $82,420 |
| 2022 | $4,296 | $91,020 | $8,600 | $82,420 |
| 2021 | $4,069 | $91,020 | $8,600 | $82,420 |
| 2020 | $3,899 | $67,090 | $8,400 | $58,690 |
| 2019 | $3,899 | $67,090 | $8,400 | $58,690 |
| 2018 | $3,924 | $67,090 | $8,400 | $58,690 |
| 2017 | $3,789 | $67,090 | $8,400 | $58,690 |
| 2016 | $3,789 | $67,090 | $8,400 | $58,690 |
| 2015 | $3,971 | $64,260 | $7,400 | $56,860 |
| 2014 | $3,621 | $64,260 | $7,400 | $56,860 |
Source: Public Records
Map
Nearby Homes
- 2001 NE Oak Trail Rd
- 1615 Cresent St
- 1810 NE Chaucer St
- 1905 NE Frost Dr
- 3000 NE Doyle Dr
- 1907 NE Frost Dr
- 0 NE Doyle Dr
- 3101 NE Doyle Dr
- 3103 NE Doyle Dr
- 1210 Spring St
- 1903 NE Steinbeck Dr
- 1907 NE Steinbeck Dr
- 2205 NE Steinbeck Dr
- 1500 Linwood Cir
- 1402 NE Fairwinds Dr
- 1210 Rice Rd
- 3907 NE Cadbury Ave
- 4302 NE Kensington Ave
- 4103 NE Kensington Ave
- 1303 NE Fairwinds Dr
- 3502 NE Oaktrace Ave
- 3406 NE Oaktrace Ave
- 3501 NE Oaktrace Ave
- 3404 NE Oaktrace Ave
- 3504 NE Oaktrace Ave
- 3407 NE Oaktrace Ave
- 3503 NE Oaktrace Ave
- 3505 NE Oaktrace Ave
- 2005 NE Oakview Cove
- 3402 NE Oaktrace Ave
- 3405 NE Oaktrace Ave
- 3601 NE Oaktrace Ave
- 3302 NE Oaktrace Ave
- 3403 NE Oaktrace Ave
- 2003 NE Oakview
- 3300 Oak Trace Ave
- 3300 & 3301 NE Oaktrace Ave
- 3300 NE Oaktrace Ave
- 2004 NE Oakview Cove
- 3401 NE Oaktrace Ave