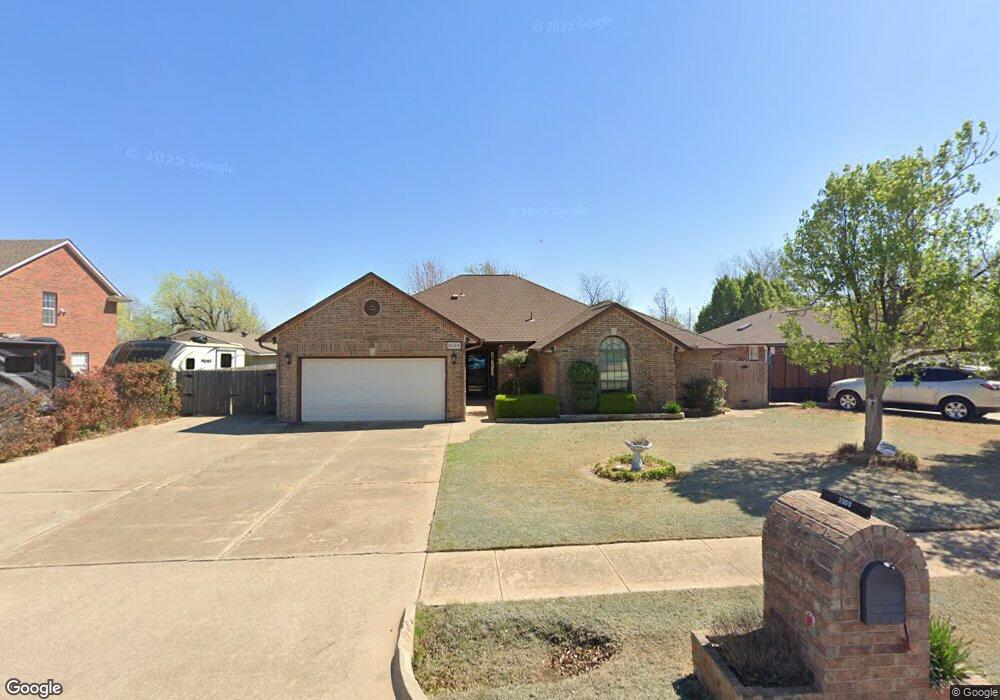
3500 S Wofford Ave Oklahoma City, OK 73115
Estimated Value: $257,656 - $274,000
3
Beds
2
Baths
2,074
Sq Ft
$127/Sq Ft
Est. Value
About This Home
This home is located at 3500 S Wofford Ave, Oklahoma City, OK 73115 and is currently estimated at $264,164, approximately $127 per square foot. 3500 S Wofford Ave is a home located in Oklahoma County with nearby schools including Townsend Elementary School, Kerr Middle School, and Del City High School.
Ownership History
Date
Name
Owned For
Owner Type
Purchase Details
Closed on
Sep 26, 2014
Sold by
Roberts Gregg R and Roberts Gregory Ronald
Bought by
Roberts Tonya R
Current Estimated Value
Home Financials for this Owner
Home Financials are based on the most recent Mortgage that was taken out on this home.
Original Mortgage
$117,000
Outstanding Balance
$90,125
Interest Rate
4.23%
Mortgage Type
New Conventional
Estimated Equity
$174,039
Purchase Details
Closed on
May 8, 2013
Sold by
Bromley Linda M
Bought by
Roberts Gregg R and Roberts Tonya M
Home Financials for this Owner
Home Financials are based on the most recent Mortgage that was taken out on this home.
Original Mortgage
$118,064
Interest Rate
3.61%
Mortgage Type
New Conventional
Purchase Details
Closed on
Nov 14, 2012
Sold by
Mcgehee Eugenia Tilley
Bought by
Mcgehee Eugenia Tilley and Campbell Shuan Thomas
Purchase Details
Closed on
Sep 17, 2003
Sold by
Stover Glenda Joyce and Emmitt Lester Givens Revocable
Bought by
Bromley Gerald D and Bromley Linda M
Purchase Details
Closed on
May 30, 1997
Sold by
Givens Lester
Bought by
Givens Emmitt Lester
Create a Home Valuation Report for This Property
The Home Valuation Report is an in-depth analysis detailing your home's value as well as a comparison with similar homes in the area
Home Values in the Area
Average Home Value in this Area
Purchase History
| Date | Buyer | Sale Price | Title Company |
|---|---|---|---|
| Roberts Tonya R | -- | Fatco | |
| Roberts Gregg R | $148,000 | None Available | |
| Mcgehee Eugenia Tilley | -- | None Available | |
| Bromley Gerald D | $145,000 | First American Title & Tr Co | |
| Givens Emmitt Lester | -- | -- |
Source: Public Records
Mortgage History
| Date | Status | Borrower | Loan Amount |
|---|---|---|---|
| Open | Roberts Tonya R | $117,000 | |
| Closed | Roberts Gregg R | $118,064 |
Source: Public Records
Tax History Compared to Growth
Tax History
| Year | Tax Paid | Tax Assessment Tax Assessment Total Assessment is a certain percentage of the fair market value that is determined by local assessors to be the total taxable value of land and additions on the property. | Land | Improvement |
|---|---|---|---|---|
| 2024 | $2,267 | $21,789 | $3,198 | $18,591 |
| 2023 | $2,267 | $21,154 | $3,145 | $18,009 |
| 2022 | $2,164 | $20,538 | $3,597 | $16,941 |
| 2021 | $2,172 | $19,940 | $3,973 | $15,967 |
| 2020 | $2,162 | $19,360 | $3,226 | $16,134 |
| 2019 | $2,065 | $19,085 | $3,226 | $15,859 |
| 2018 | $2,069 | $18,865 | $0 | $0 |
| 2017 | $2,070 | $18,754 | $3,226 | $15,528 |
| 2016 | $2,475 | $20,646 | $3,226 | $17,420 |
| 2015 | $1,951 | $17,182 | $2,695 | $14,487 |
| 2014 | $2,006 | $16,682 | $2,741 | $13,941 |
Source: Public Records
Map
Nearby Homes
- 4300 SE 37th St
- 4540 SE 35th St
- 4428 SE 38th St
- 4428 SE 39th St
- 4700 Elmview Dr
- 4704 Tempo Dr
- 4125 Overland Dr
- 4205 Epperly Dr
- 4113 Monica Dr
- 4521 SE 27th St
- 4613 SE 41st St
- 4113 Vickie Dr
- 8113 S Sunnylane Rd
- 3413 Del View Dr
- 4601 SE 26th St
- 4625 SE 42nd St
- 3500 Del View Dr
- 3128 Del View Dr
- 4228 SE 24th St
- 4732 Princess Ln
- 3508 S Wofford Ave
- 3412 S Wofford Ave
- 3501 S Wofford Ave
- 4401 SE 35th St
- 3413 S Wofford Ave
- 3409 S Wofford Ave
- 3509 S Wofford Ave
- 4405 SE 35th St
- 3505 S Wofford Ave
- 4400 SE 33rd St
- 3405 S Wofford Ave
- 3515 S Wofford Ave
- 4404 SE 33rd St
- 4408 SE 33rd St
- 3403 S Wofford Ave
- 3600 S Wofford Ave
- 4415 SE 35th St
- 4412 SE 33rd St
- 4316 SE 35th St
- 4404 SE 35th St