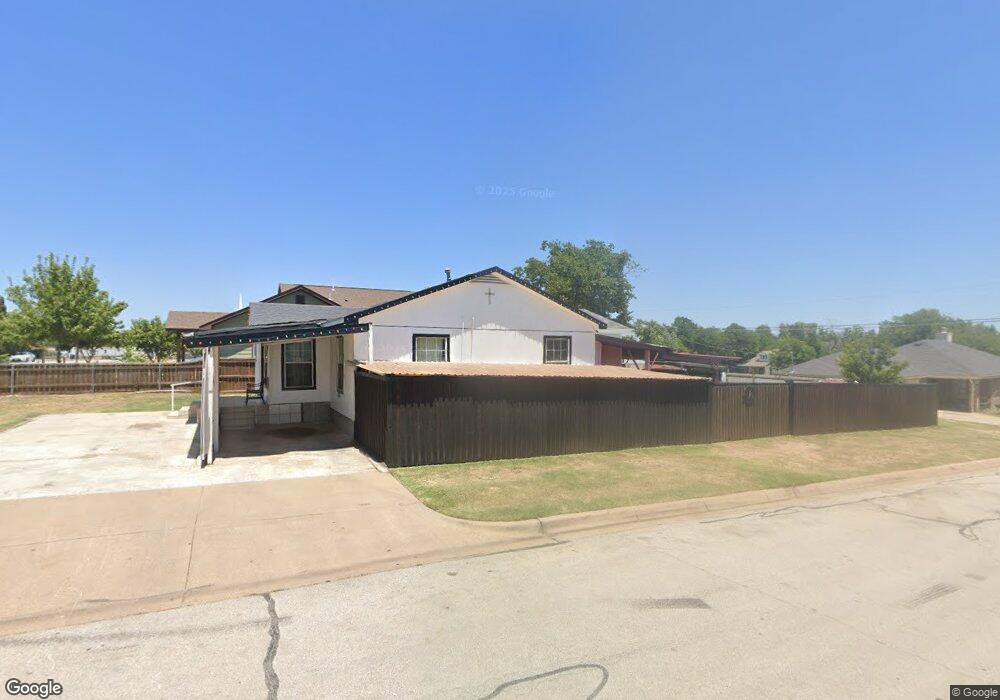
3500 Schwartz Ave Fort Worth, TX 76106
Diamond Hill-Jarvis NeighborhoodEstimated Value: $190,135 - $207,000
3
Beds
1
Bath
1,080
Sq Ft
$188/Sq Ft
Est. Value
About This Home
This home is located at 3500 Schwartz Ave, Fort Worth, TX 76106 and is currently estimated at $202,534, approximately $187 per square foot. 3500 Schwartz Ave is a home located in Tarrant County with nearby schools including Cesar Chavez Primary School, Meacham Middle School, and Diamond Hill-Jarvis High School.
Ownership History
Date
Name
Owned For
Owner Type
Purchase Details
Closed on
May 24, 2007
Sold by
Mendez Rigoberto and Garcia Rosa Santos
Bought by
Salas Jose Antonio
Current Estimated Value
Home Financials for this Owner
Home Financials are based on the most recent Mortgage that was taken out on this home.
Original Mortgage
$64,600
Outstanding Balance
$39,294
Interest Rate
6.17%
Mortgage Type
Purchase Money Mortgage
Estimated Equity
$163,240
Purchase Details
Closed on
Jan 3, 2005
Sold by
Gonzalez Maria Guadalupe and Mendez Maria Guadalupe
Bought by
Mendez Rigoberto
Purchase Details
Closed on
Feb 26, 2003
Sold by
Mendez Rigoberto
Bought by
Garcia Rosa Santos and Mendez Rigoberto
Purchase Details
Closed on
Nov 2, 1999
Sold by
Mora Oscar Casiano
Bought by
Mora Ola May
Create a Home Valuation Report for This Property
The Home Valuation Report is an in-depth analysis detailing your home's value as well as a comparison with similar homes in the area
Home Values in the Area
Average Home Value in this Area
Purchase History
| Date | Buyer | Sale Price | Title Company |
|---|---|---|---|
| Salas Jose Antonio | -- | Republic Title Of Texas | |
| Mendez Rigoberto | -- | Commerce Title | |
| Garcia Rosa Santos | -- | -- | |
| Mora Ola May | -- | -- |
Source: Public Records
Mortgage History
| Date | Status | Borrower | Loan Amount |
|---|---|---|---|
| Open | Salas Jose Antonio | $64,600 |
Source: Public Records
Tax History Compared to Growth
Tax History
| Year | Tax Paid | Tax Assessment Tax Assessment Total Assessment is a certain percentage of the fair market value that is determined by local assessors to be the total taxable value of land and additions on the property. | Land | Improvement |
|---|---|---|---|---|
| 2025 | $4,077 | $181,701 | $37,800 | $143,901 |
| 2024 | $4,077 | $181,701 | $37,800 | $143,901 |
| 2023 | $3,592 | $158,729 | $27,000 | $131,729 |
| 2022 | $3,390 | $130,392 | $10,000 | $120,392 |
| 2021 | $3,102 | $113,068 | $10,000 | $103,068 |
| 2020 | $2,260 | $85,404 | $10,000 | $75,404 |
| 2019 | $2,369 | $86,115 | $10,000 | $76,115 |
| 2018 | $1,951 | $70,919 | $10,000 | $60,919 |
| 2017 | $1,619 | $57,138 | $10,000 | $47,138 |
| 2016 | $1,631 | $57,570 | $10,000 | $47,570 |
| 2015 | $1,683 | $59,300 | $8,300 | $51,000 |
| 2014 | $1,683 | $59,300 | $8,300 | $51,000 |
Source: Public Records
Map
Nearby Homes
- 3107 Weber St
- 3209 Deen Rd
- 1600 Beaumont St
- 3809 Grover Ave
- 3224 N Hampton St
- 3300 Ray Simon Dr
- 2529 Vera Cruz St
- 2601 Hutchinson St
- 2908 Lulu St
- 1317 Norman St
- 2640 Hutchinson St
- 3114 N Pecan St
- 2521 Bruce St
- 2512 Highcrest Ave
- 2613 Hale Ave
- 2509 Irion Ave
- 3105 N Pecan St
- 2603 Malone St
- 2504 Oxford Ave
- 3216 Ellis Ave
- 3502 Schwartz Ave
- 3464 Schwartz Ave
- 3501 Oscar Ave
- 3462 Schwartz Ave
- 3465 Oscar Ave
- 3501 Schwartz Ave
- 3460 Schwartz Ave
- 3503 Schwartz Ave
- 3505 Schwartz Ave
- 3465 Schwartz Ave
- 3461 Oscar Ave
- 3507 Schwartz Ave
- 3458 Schwartz Ave
- 3463 Schwartz Ave
- 3511 Oscar Ave
- 3459 Oscar Ave
- 3509 Schwartz Ave
- 3461 Schwartz Ave
- 3456 Schwartz Ave
- 3464 Oscar Ave