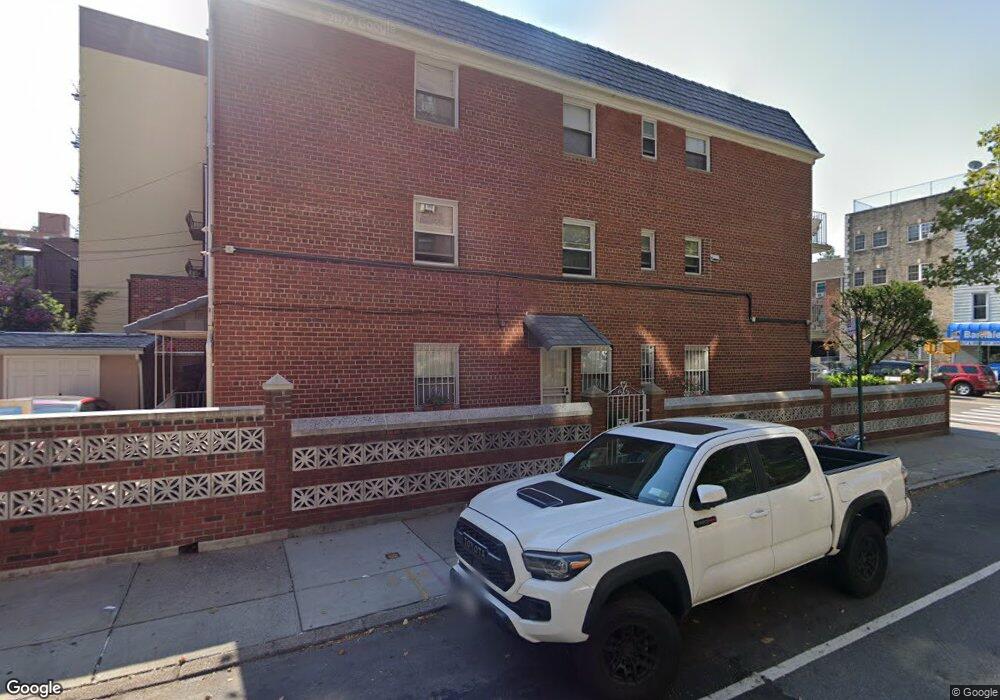
3501 28th Ave Astoria, NY 11103
Astoria NeighborhoodEstimated Value: $1,483,000 - $2,005,000
--
Bed
--
Bath
3,498
Sq Ft
$499/Sq Ft
Est. Value
About This Home
This home is located at 3501 28th Ave, Astoria, NY 11103 and is currently estimated at $1,744,000, approximately $498 per square foot. 3501 28th Ave is a home located in Queens County with nearby schools including I.S. 010 Horace Greeley, Long Island City High School, and St Joseph Catholic Academy.
Ownership History
Date
Name
Owned For
Owner Type
Purchase Details
Closed on
Apr 28, 2025
Sold by
Mantzoukas Thomas
Bought by
Declaration Of Trust Of Thomas Mantzouka and Katherine Neuman Co Trustee
Current Estimated Value
Purchase Details
Closed on
Oct 30, 2021
Sold by
Katherine Neuman Asset Management Trust and Katherine Neuman Co Trustee
Bought by
Mantzoukas Thomas
Purchase Details
Closed on
May 5, 2005
Sold by
Neuman Katherine
Bought by
Katherine Neuman Asset Managment Trust
Purchase Details
Closed on
Dec 23, 2004
Sold by
Mantzoukas Thomas
Bought by
Neuman Katherine
Purchase Details
Closed on
Jan 3, 2000
Sold by
Neuman Katherine
Bought by
Mantzoukas Thomas
Purchase Details
Closed on
Jun 23, 1997
Sold by
Mantzoukas Mary
Bought by
Neuman Katherine
Create a Home Valuation Report for This Property
The Home Valuation Report is an in-depth analysis detailing your home's value as well as a comparison with similar homes in the area
Home Values in the Area
Average Home Value in this Area
Purchase History
| Date | Buyer | Sale Price | Title Company |
|---|---|---|---|
| Declaration Of Trust Of Thomas Mantzouka | -- | -- | |
| Mantzoukas Thomas | -- | -- | |
| Mantzoukas Thomas | -- | -- | |
| Mantzoukas Thomas | -- | -- | |
| Katherine Neuman Asset Managment Trust | -- | -- | |
| Katherine Neuman Asset Managment Trust | -- | -- | |
| Neuman Katherine | -- | -- | |
| Neuman Katherine | -- | -- | |
| Mantzoukas Thomas | -- | -- | |
| Mantzoukas Thomas | -- | -- | |
| Neuman Katherine | -- | First American Title Ins Co | |
| Mantzoukas Mary | -- | First American Title Ins Co | |
| Neuman Katherine | -- | First American Title Ins Co |
Source: Public Records
Tax History Compared to Growth
Tax History
| Year | Tax Paid | Tax Assessment Tax Assessment Total Assessment is a certain percentage of the fair market value that is determined by local assessors to be the total taxable value of land and additions on the property. | Land | Improvement |
|---|---|---|---|---|
| 2025 | $14,352 | $77,226 | $14,230 | $62,996 |
| 2024 | $14,364 | $72,857 | $16,083 | $56,774 |
| 2023 | $13,752 | $69,871 | $13,131 | $56,740 |
| 2022 | $13,661 | $117,000 | $20,940 | $96,060 |
| 2021 | $14,060 | $118,260 | $20,940 | $97,320 |
| 2020 | $13,326 | $118,620 | $20,940 | $97,680 |
| 2019 | $12,408 | $113,460 | $20,940 | $92,520 |
| 2018 | $11,572 | $58,226 | $13,161 | $45,065 |
| 2017 | $11,570 | $58,226 | $11,632 | $46,594 |
| 2016 | $11,054 | $58,226 | $11,632 | $46,594 |
| 2015 | $6,405 | $53,629 | $13,361 | $40,268 |
| 2014 | $6,405 | $50,595 | $15,132 | $35,463 |
Source: Public Records
Map
Nearby Homes
- 25 W 28th St Unit PH 42 B
- 25 W 28th St Unit 41D
- 25 W 28th St Unit PH 43 A
- 25 W 28th St Unit PH 40 C
- 2590 37th St
- 25-68 34th St
- 25-54 37th St
- 25-64 38th St
- 2569 38th St Unit 1R
- 25-63 38th St Unit 1A
- 2540 32nd St
- 31-10 28th Rd Unit A1
- 24-75 38th St Unit A1
- 24-75 38th St Unit 5C
- 24-75 38th St Unit C9
- 24-75 38th St Unit A10
- 24-75 38th St Unit D7/D8
- 24-65 38 St Unit D10
- 24-65 38th St Unit D4
- 24-65 38th St Unit A5
- 3503 28th Ave
- 35-03 28th Ave Unit 2
- 3507 28th Ave
- 2589 35th St
- 35-09 28th Ave Unit 2G
- 35-09 28th Ave Unit 2F
- 3509 28th Ave
- 2587 35th St
- 34-27 28th Ave Unit 3R
- 2583 35th St
- 25-90 35th St Unit 2-E
- 25-90 35 Th St Unit 6 B
- 25-90 35 Th St Unit 1 L
- 25-90 35 Th St Unit 6 J
- 25-90 35 Th St Unit 4 A
- 25-90 35 Th St Unit 2-B
- 25-90 35 Th St Unit 3 D
- 25-90 35 Th St Unit 4 K
- 25-90 35 Th St Unit 4 J
- 25-90 35 Th St Unit 4 B