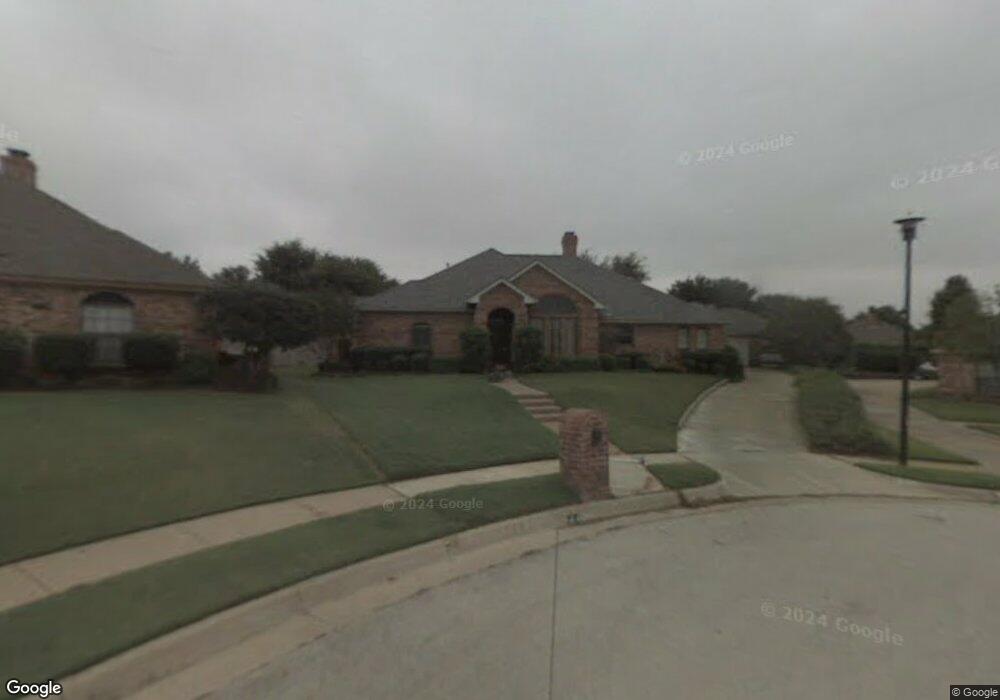
3501 Brookside Ct Bedford, TX 76021
Estimated Value: $545,000 - $562,981
4
Beds
3
Baths
2,705
Sq Ft
$205/Sq Ft
Est. Value
About This Home
This home is located at 3501 Brookside Ct, Bedford, TX 76021 and is currently estimated at $555,495, approximately $205 per square foot. 3501 Brookside Ct is a home located in Tarrant County with nearby schools including Spring Garden Elementary School, Harwood Junior High School, and Trinity High School.
Ownership History
Date
Name
Owned For
Owner Type
Purchase Details
Closed on
Mar 4, 2015
Sold by
Jones David A
Bought by
Jones Vivianne E
Current Estimated Value
Purchase Details
Closed on
Feb 19, 1999
Sold by
Harris Thomas M and Harris Brenda F
Bought by
Jones David A and Jones Vivianne E
Home Financials for this Owner
Home Financials are based on the most recent Mortgage that was taken out on this home.
Original Mortgage
$67,000
Outstanding Balance
$15,913
Interest Rate
6.78%
Estimated Equity
$539,582
Purchase Details
Closed on
Dec 1, 1995
Sold by
Delee David R and Delee Linda A
Bought by
Harris Thomas M and Harris Brenda F
Home Financials for this Owner
Home Financials are based on the most recent Mortgage that was taken out on this home.
Original Mortgage
$136,800
Interest Rate
7.36%
Create a Home Valuation Report for This Property
The Home Valuation Report is an in-depth analysis detailing your home's value as well as a comparison with similar homes in the area
Home Values in the Area
Average Home Value in this Area
Purchase History
| Date | Buyer | Sale Price | Title Company |
|---|---|---|---|
| Jones Vivianne E | -- | None Available | |
| Jones David A | -- | Safeco Land Title | |
| Harris Thomas M | -- | First American Title Co |
Source: Public Records
Mortgage History
| Date | Status | Borrower | Loan Amount |
|---|---|---|---|
| Open | Jones David A | $67,000 | |
| Previous Owner | Harris Thomas M | $136,800 |
Source: Public Records
Tax History Compared to Growth
Tax History
| Year | Tax Paid | Tax Assessment Tax Assessment Total Assessment is a certain percentage of the fair market value that is determined by local assessors to be the total taxable value of land and additions on the property. | Land | Improvement |
|---|---|---|---|---|
| 2025 | $8,021 | $509,077 | $100,000 | $409,077 |
| 2024 | $8,021 | $509,077 | $100,000 | $409,077 |
| 2023 | $8,420 | $438,975 | $60,000 | $378,975 |
| 2022 | $8,724 | $422,984 | $60,000 | $362,984 |
| 2021 | $8,554 | $405,212 | $60,000 | $345,212 |
| 2020 | $7,849 | $342,455 | $60,000 | $282,455 |
| 2019 | $7,290 | $365,684 | $60,000 | $305,684 |
| 2018 | $6,246 | $272,815 | $60,000 | $212,815 |
| 2017 | $6,830 | $282,321 | $45,000 | $237,321 |
| 2016 | $6,365 | $275,350 | $45,000 | $230,350 |
| 2015 | $5,732 | $239,200 | $30,000 | $209,200 |
| 2014 | $5,732 | $239,200 | $30,000 | $209,200 |
Source: Public Records
Map
Nearby Homes
- 3532 Meadowside Dr
- 3513 Meadowside Dr
- 1800 Hampton Dr
- 2209 Laurel Ct
- 1820 Wimbleton Dr
- 1704 Indian Oaks Ct
- 3840 Edgewater Dr
- 1636 Bedford Oaks Dr
- 1723 Post Oak Dr
- 3152 Woodbridge Dr
- 2220 Tiffany Glenn Ct
- 22 Lincolnshire Cir
- 1630 Post Oak Dr
- 3827 Ashbury Ln
- 3813 Brookridge Ct
- 3721 Fieldcrest Ln
- Seaberry II Plan at Grace Park - Signature Series
- Primrose FE V Plan at Grace Park - Signature Series
- Hawthorne Plan at Grace Park - Signature Series
- Seaberry Plan at Grace Park - Signature Series
- 3500 Brookside Ct
- 1913 Glenbrook Ct
- 3505 Brookside Ct
- 1917 Glenbrook Ct
- 1909 Glenbrook Ct
- 1921 Glenbrook Ct
- 3504 Brookside Ct
- 3536 Meadowside Dr
- 1905 Glenbrook Ct
- 3404 Meadowside Dr
- 3508 Brookside Ct
- 1925 Glenbrook Ct
- 3408 Meadowside Dr
- 3528 Meadowside Dr
- 3513 Brookside Ct
- 1901 Glenbrook Ct
- 1912 Glenbrook Ct
- 3412 Meadowside Dr
- 1916 Glenbrook Ct
- 1908 Glenbrook Ct