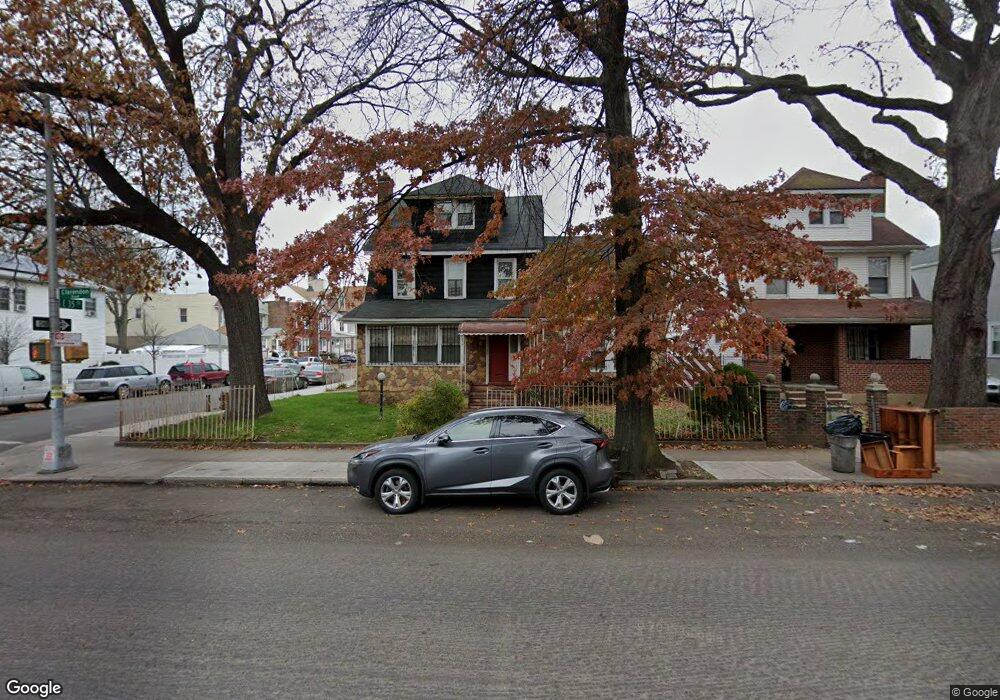
3501 Clarendon Rd Unit 3503 Brooklyn, NY 11203
East Flatbush NeighborhoodEstimated Value: $897,131 - $1,546,000
--
Bed
--
Bath
2,881
Sq Ft
$375/Sq Ft
Est. Value
About This Home
This home is located at 3501 Clarendon Rd Unit 3503, Brooklyn, NY 11203 and is currently estimated at $1,080,283, approximately $374 per square foot. 3501 Clarendon Rd Unit 3503 is a home located in Kings County with nearby schools including P.S. 181, Middle School 246 Walt Whitman, and Central Brooklyn Ascend Charter.
Ownership History
Date
Name
Owned For
Owner Type
Purchase Details
Closed on
Mar 17, 2005
Sold by
Louis Jacques and Louis Joseph C
Bought by
St Fort Rosy
Current Estimated Value
Home Financials for this Owner
Home Financials are based on the most recent Mortgage that was taken out on this home.
Original Mortgage
$441,000
Interest Rate
5.61%
Mortgage Type
Purchase Money Mortgage
Purchase Details
Closed on
May 7, 2004
Sold by
Louis Jacques and Louis Joseph C
Bought by
Louis Joseph C
Purchase Details
Closed on
Dec 16, 2003
Sold by
Louis Joseph C
Bought by
Louis Jacques
Purchase Details
Closed on
Apr 18, 1996
Sold by
Louis Joseph C and Louis Marie Therese
Bought by
Louis Joseph C
Home Financials for this Owner
Home Financials are based on the most recent Mortgage that was taken out on this home.
Original Mortgage
$130,000
Interest Rate
7.81%
Create a Home Valuation Report for This Property
The Home Valuation Report is an in-depth analysis detailing your home's value as well as a comparison with similar homes in the area
Home Values in the Area
Average Home Value in this Area
Purchase History
| Date | Buyer | Sale Price | Title Company |
|---|---|---|---|
| St Fort Rosy | $490,000 | -- | |
| St Fort Rosy | $490,000 | -- | |
| Louis Joseph C | -- | -- | |
| Louis Joseph C | -- | -- | |
| Louis Jacques | -- | -- | |
| Louis Jacques | -- | -- | |
| Louis Joseph C | $98,058 | Uslife Title Insurance Compa | |
| Louis Joseph C | -- | Uslife Title Insurance Compa |
Source: Public Records
Mortgage History
| Date | Status | Borrower | Loan Amount |
|---|---|---|---|
| Previous Owner | St Fort Rosy | $441,000 | |
| Previous Owner | Louis Joseph C | $130,000 |
Source: Public Records
Tax History Compared to Growth
Tax History
| Year | Tax Paid | Tax Assessment Tax Assessment Total Assessment is a certain percentage of the fair market value that is determined by local assessors to be the total taxable value of land and additions on the property. | Land | Improvement |
|---|---|---|---|---|
| 2025 | $9,463 | $86,160 | $24,180 | $61,980 |
| 2024 | $9,463 | $75,240 | $24,180 | $51,060 |
| 2023 | $9,030 | $72,600 | $24,180 | $48,420 |
| 2022 | $8,376 | $59,400 | $24,180 | $35,220 |
| 2021 | $8,332 | $65,160 | $24,180 | $40,980 |
| 2020 | $4,142 | $60,720 | $24,180 | $36,540 |
| 2019 | $8,214 | $60,720 | $24,180 | $36,540 |
| 2018 | $7,553 | $37,053 | $17,283 | $19,770 |
| 2017 | $7,127 | $34,963 | $15,993 | $18,970 |
| 2016 | $6,595 | $32,992 | $18,364 | $14,628 |
| 2015 | $3,978 | $32,992 | $19,471 | $13,521 |
| 2014 | $3,978 | $32,720 | $16,426 | $16,294 |
Source: Public Records
Map
Nearby Homes
- 1194 Brooklyn Ave
- 3317 Clarendon Rd
- 558 E 34th St
- 1169 Brooklyn Ave
- 565 E 37th St
- 1196 New York Ave
- 616 E 37th St
- 1114 Brooklyn Ave
- 3820 Clarendon Rd
- 592 E 39th St
- 337 E 35th St
- 3324 Tilden Ave
- 660 E 37th St
- 518 E 40th St
- 1322 New York Ave
- 381 E 31st St
- 1773 Nostrand Ave
- 4008 Clarendon Rd
- 1685 Nostrand Ave
- 604 E 38th St
- 3501-3503 Clarendon Rd
- 3503 Clarendon Rd
- 3509 Clarendon Rd
- 455 E 35th St
- 3515 Clarendon Rd
- 453 E 35th St
- 3423 Clarendon Rd
- 3517 Clarendon Rd
- 449 E 35th St
- 3421 Clarendon Rd
- 3519 Clarendon Rd
- 447 E 35th St
- 3417 Clarendon Rd
- 3521 Clarendon Rd
- 445 E 35th St
- 456 E 35th St
- 3415 Clarendon Rd
- 454 E 35th St
- 1204 Brooklyn Ave
- 3523 Clarendon Rd