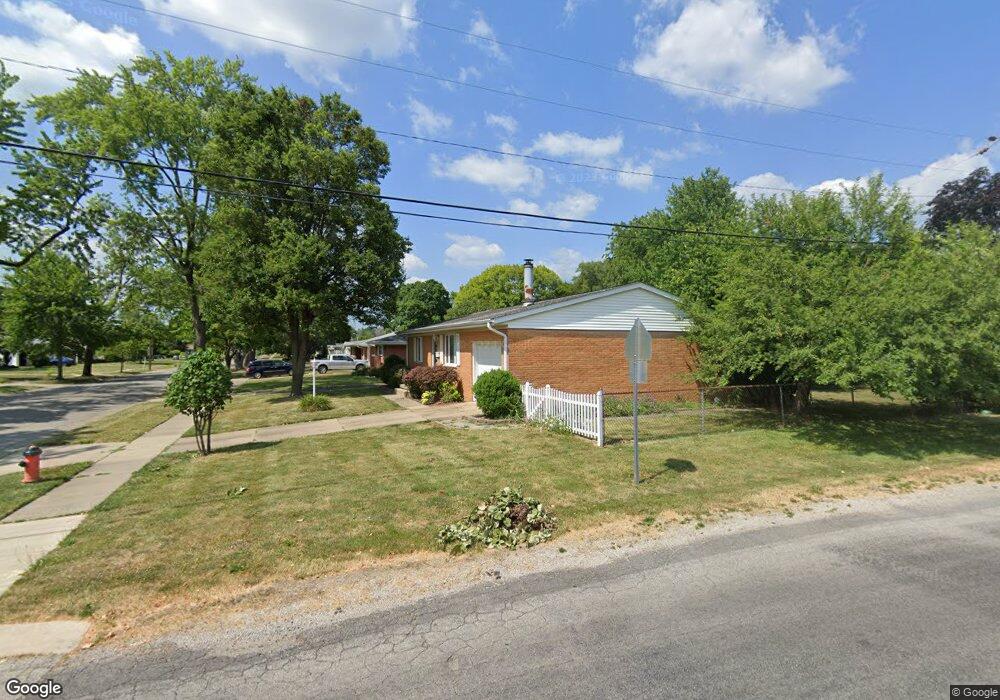
3501 E Ridgely #96 Springfield, IL 62702
Estimated Value: $3,850,392
Studio
2
Baths
--
Sq Ft
742,262
Sq Ft Lot
About This Home
This home is located at 3501 E Ridgely #96, Springfield, IL 62702 and is currently priced at $3,850,392. 3501 E Ridgely #96 is a home located in Sangamon County with nearby schools including Matheny-Withrow Elementary School, Jefferson Middle School, and Lanphier High School.
Ownership History
Date
Name
Owned For
Owner Type
Purchase Details
Closed on
Oct 14, 2021
Sold by
Tri-State Property Llc
Bought by
Yes Fremont Grove Llc
Current Estimated Value
Home Financials for this Owner
Home Financials are based on the most recent Mortgage that was taken out on this home.
Original Mortgage
$6,732,000
Outstanding Balance
$3,128,195
Interest Rate
2.8%
Mortgage Type
New Conventional
Purchase Details
Closed on
Mar 2, 2016
Purchase Details
Closed on
Aug 9, 2011
Purchase Details
Closed on
Oct 22, 2009
Purchase Details
Closed on
Sep 25, 2008
Purchase Details
Closed on
Oct 26, 2005
Create a Home Valuation Report for This Property
The Home Valuation Report is an in-depth analysis detailing your home's value as well as a comparison with similar homes in the area
Purchase History
| Date | Buyer | Sale Price | Title Company |
|---|---|---|---|
| Yes Fremont Grove Llc | $2,000,000 | Clifford Chance Us Llp | |
| Yes Fremont Grove Llc | $3,250,000 | Clifford Chance Us Llp | |
| Yes Fremont Grove Llc | $3,000,000 | Clifford Chance Us Llp | |
| -- | -- | -- | |
| -- | -- | -- | |
| -- | -- | -- | |
| -- | $2,162,000 | -- | |
| -- | -- | -- |
Source: Public Records
Mortgage History
| Date | Status | Borrower | Loan Amount |
|---|---|---|---|
| Open | Yes Fremont Grove Llc | $6,732,000 | |
| Closed | Yes Fremont Grove Llc | $6,732,000 |
Source: Public Records
Tax History
| Year | Tax Paid | Tax Assessment Tax Assessment Total Assessment is a certain percentage of the fair market value that is determined by local assessors to be the total taxable value of land and additions on the property. | Land | Improvement |
|---|---|---|---|---|
| 2024 | $36,427 | $438,702 | $124,535 | $314,167 |
| 2023 | $35,018 | $400,714 | $113,751 | $286,963 |
| 2022 | $33,663 | $380,112 | $107,903 | $272,209 |
| 2021 | $32,545 | $365,880 | $103,863 | $262,017 |
| 2020 | $31,896 | $366,430 | $104,019 | $262,411 |
| 2019 | $31,246 | $364,447 | $103,655 | $260,792 |
| 2018 | $31,388 | $375,893 | $103,363 | $272,530 |
| 2017 | $30,737 | $371,032 | $102,026 | $269,006 |
| 2016 | $34,077 | $413,533 | $100,538 | $312,995 |
| 2015 | $33,773 | $408,589 | $99,336 | $309,253 |
| 2014 | $33,641 | $405,950 | $98,694 | $307,256 |
| 2013 | $32,890 | $405,950 | $98,694 | $307,256 |
Source: Public Records
Map
Nearby Homes
- 3451 Ridge Ave Unit 65
- 3617 N Grand Ave E Unit 256
- 3401 Ridge Ave Unit 20
- 2800 E Keys Ave
- 1624 N 28th St
- 2373 E Keys Ave
- 2612 Sandgate Rd
- 2444 Basil Dr
- 2314 Ramsey Rd
- 2264 E Eleanor Ave
- 29 Melody Ln
- 2256 E Black Ave
- 2304 Sutherland Rd
- 1037 N Wesley St Unit 1
- 3058 Twin Lakes Dr
- 1921 N Albany St
- 2267 Cincinnati Ave
- 3100 Angelo
- 3136 Lakeshire Dr
- 516 N Milton Ave Unit 1
- 3501 Ridgely Rd Unit 85
- 3501 Ridgely Rd Unit 68
- 3501 E Ridgely Road #68
- 3501 Ridgely Road #87
- 3501 Ridgely Rd Unit 99
- 3501 Ridgely Rd
- 3501 E Ridgely Rd
- 3501 E Ridgely Rd Unit 96
- 3561 E Ridgely Rd
- 3319 Ridgewood Ave Unit Lot 46
- 3319 Ridgewood Ave
- 3319 Ridgewood Ave Unit 19
- 3319 Ridgewood Ave Unit 75
- 3400 Ridgely
- 3451 Ridge Ave 68
- 3451 Ridge Ave Unit 53
- 3451 Ridge Ave Unit Lot 1
- 3451 Ridge Ave Unit 7
- 3451 Ridge Ave Unit 68
- 3451 Ridge Ave Unit 67
Your Personal Tour Guide
Ask me questions while you tour the home.