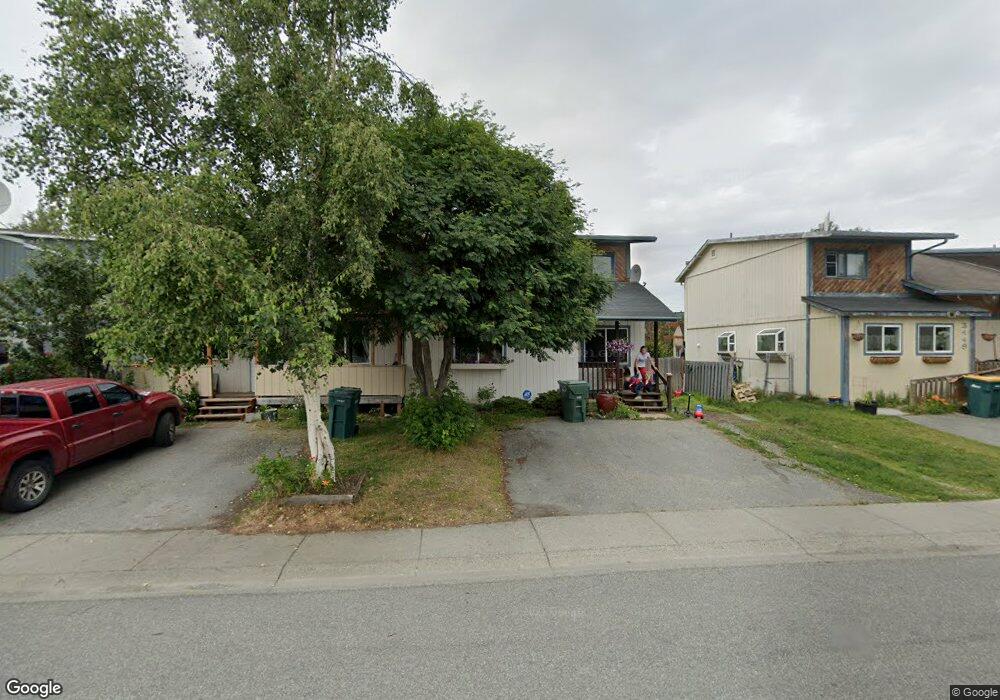
3501 Grissom Cir Anchorage, AK 99517
Turnagain NeighborhoodEstimated Value: $239,000 - $333,997
4
Beds
2
Baths
1,344
Sq Ft
$223/Sq Ft
Est. Value
About This Home
This home is located at 3501 Grissom Cir, Anchorage, AK 99517 and is currently estimated at $299,999, approximately $223 per square foot. 3501 Grissom Cir is a home located in Anchorage Municipality with nearby schools including Lake Hood Elementary School, Romig Middle School, and West High School.
Ownership History
Date
Name
Owned For
Owner Type
Purchase Details
Closed on
Jun 26, 2006
Sold by
Riedl Catherine H
Bought by
Tornberg Kurt Alan and Tornberg Elisa Faye
Current Estimated Value
Home Financials for this Owner
Home Financials are based on the most recent Mortgage that was taken out on this home.
Original Mortgage
$154,000
Outstanding Balance
$94,680
Interest Rate
7.5%
Mortgage Type
Purchase Money Mortgage
Estimated Equity
$205,319
Purchase Details
Closed on
Oct 23, 2003
Sold by
Suh Hae Won and Suh Young O
Bought by
Riedl Catherine H
Home Financials for this Owner
Home Financials are based on the most recent Mortgage that was taken out on this home.
Original Mortgage
$143,863
Interest Rate
6.14%
Mortgage Type
FHA
Purchase Details
Closed on
Mar 18, 1994
Sold by
Walkden Joseph C and Walkden Katherine A
Bought by
Suh Hae Won and Suh Young O
Home Financials for this Owner
Home Financials are based on the most recent Mortgage that was taken out on this home.
Original Mortgage
$79,988
Interest Rate
7%
Mortgage Type
FHA
Create a Home Valuation Report for This Property
The Home Valuation Report is an in-depth analysis detailing your home's value as well as a comparison with similar homes in the area
Home Values in the Area
Average Home Value in this Area
Purchase History
| Date | Buyer | Sale Price | Title Company |
|---|---|---|---|
| Tornberg Kurt Alan | -- | None Available | |
| Riedl Catherine H | -- | Alyeska Title Guaranty Agenc | |
| Suh Hae Won | -- | -- | |
| Suh Hae Won | -- | -- |
Source: Public Records
Mortgage History
| Date | Status | Borrower | Loan Amount |
|---|---|---|---|
| Open | Tornberg Kurt Alan | $154,000 | |
| Previous Owner | Riedl Catherine H | $143,863 | |
| Previous Owner | Suh Hae Won | $79,988 |
Source: Public Records
Tax History Compared to Growth
Tax History
| Year | Tax Paid | Tax Assessment Tax Assessment Total Assessment is a certain percentage of the fair market value that is determined by local assessors to be the total taxable value of land and additions on the property. | Land | Improvement |
|---|---|---|---|---|
| 2025 | $2,908 | $269,100 | $84,000 | $185,100 |
| 2024 | $2,908 | $255,100 | $84,000 | $171,100 |
| 2023 | $4,050 | $237,800 | $84,000 | $153,800 |
| 2022 | $3,057 | $226,900 | $84,000 | $142,900 |
| 2021 | $3,754 | $208,300 | $84,000 | $124,300 |
| 2020 | $2,707 | $199,300 | $84,000 | $115,300 |
| 2019 | $2,584 | $197,400 | $84,000 | $113,400 |
| 2018 | $2,915 | $222,200 | $87,600 | $134,600 |
| 2017 | $3,248 | $227,400 | $83,200 | $144,200 |
| 2016 | $2,977 | $228,300 | $83,200 | $145,100 |
| 2015 | $2,977 | $216,500 | $76,000 | $140,500 |
| 2014 | $2,977 | $215,500 | $76,000 | $139,500 |
Source: Public Records
Map
Nearby Homes
- 3618 Aldren Cir
- 3900 Crosson Dr
- 3100 W 35th Ave
- 3516 Vintage Cir
- 3517 Vintage Cir
- 3100 Ward Place Unit 15
- 3100 Ward Place Unit 21
- 2820 Wiley Post Ave
- 3333 Lakeshore Dr Unit 5
- 3333 Lakeshore Dr Unit 2
- 2925 W 36th Ave
- 3932 Starburst Cir
- 2702 Mcrae Rd
- 3161 Horizon St
- 3949 Starburst Cir
- 2511 Abbey Ln
- 3835 Carleton Ave
- 2604 W 33rd Ave
- 4101 Westland Cir
- 3913 Barbara Dr
- 3449 Grissom Cir
- 3507 Grissom Cir
- 3513 Grissom Cir
- 3443 Grissom Cir
- 3519 Grissom Cir
- 3518 Carpenters Cir
- 3437 Grissom Cir
- 3524 Carpenters Cir
- 3525 Grissom Cir
- 3512 Carpenters Cir
- 3448 Sagan Cir
- 3431 Grissom Cir
- 3500 Grissom Cir
- 3530 Carpenters Cir
- 3442 Sagan Cir
- 3506 Grissom Cir
- 3448 Grissom Cir
- 3531 Grissom Cir
- 3454 Sagan Cir
- 3512 Grissom Cir