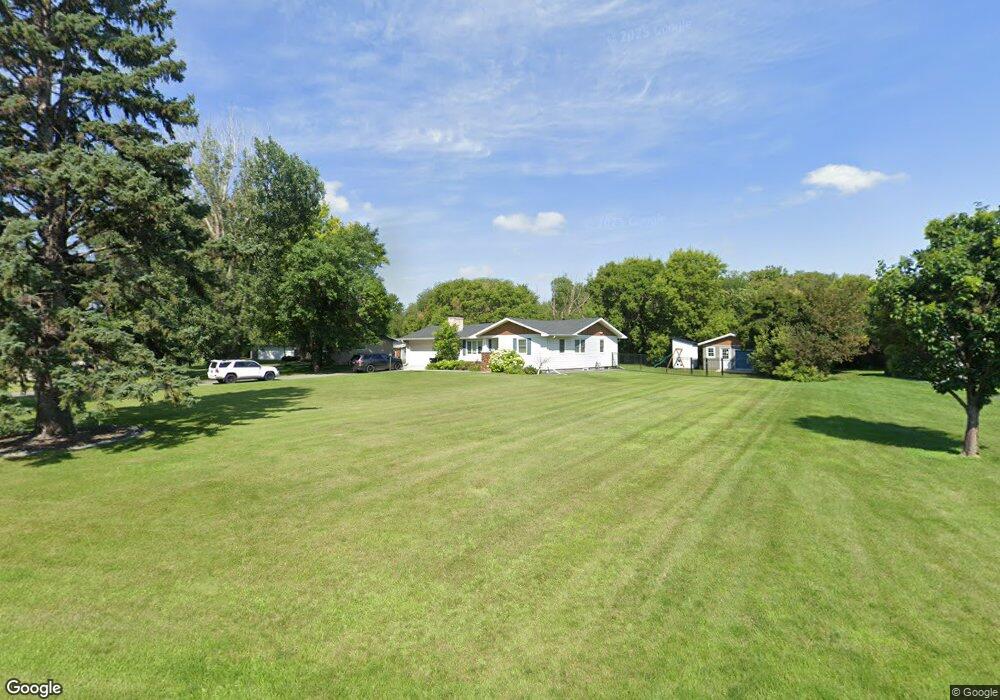
3501 Hidden Cir West Fargo, ND 58078
Knutson NeighborhoodEstimated Value: $299,000 - $398,580
3
Beds
2
Baths
1,345
Sq Ft
$277/Sq Ft
Est. Value
About This Home
This home is located at 3501 Hidden Cir, West Fargo, ND 58078 and is currently estimated at $372,395, approximately $276 per square foot. 3501 Hidden Cir is a home located in Cass County with nearby schools including Aurora Elementary School, Liberty Middle School, and West Fargo Sheyenne High School.
Ownership History
Date
Name
Owned For
Owner Type
Purchase Details
Closed on
Jul 1, 2020
Sold by
Christianson Samuel and Christianson Elizabeth
Bought by
Horner Brent and Horner Charissa Quinlan
Current Estimated Value
Home Financials for this Owner
Home Financials are based on the most recent Mortgage that was taken out on this home.
Original Mortgage
$341,905
Outstanding Balance
$303,741
Interest Rate
3.2%
Mortgage Type
New Conventional
Estimated Equity
$68,654
Purchase Details
Closed on
Jan 31, 2013
Sold by
Christianson Peter and Christianson Stephenie
Bought by
Christianson Samuel
Home Financials for this Owner
Home Financials are based on the most recent Mortgage that was taken out on this home.
Original Mortgage
$128,000
Interest Rate
3.32%
Mortgage Type
New Conventional
Purchase Details
Closed on
May 11, 2007
Sold by
Nelson Ron L and Nelson Billie Jo
Bought by
Christianson Peter and Christianson Stephanie
Create a Home Valuation Report for This Property
The Home Valuation Report is an in-depth analysis detailing your home's value as well as a comparison with similar homes in the area
Home Values in the Area
Average Home Value in this Area
Purchase History
| Date | Buyer | Sale Price | Title Company |
|---|---|---|---|
| Horner Brent | $359,900 | The Title Company | |
| Christianson Samuel | -- | None Available | |
| Christianson Peter | -- | -- |
Source: Public Records
Mortgage History
| Date | Status | Borrower | Loan Amount |
|---|---|---|---|
| Open | Horner Brent | $341,905 | |
| Previous Owner | Christianson Samuel | $128,000 |
Source: Public Records
Tax History Compared to Growth
Tax History
| Year | Tax Paid | Tax Assessment Tax Assessment Total Assessment is a certain percentage of the fair market value that is determined by local assessors to be the total taxable value of land and additions on the property. | Land | Improvement |
|---|---|---|---|---|
| 2024 | $4,943 | $182,100 | $62,250 | $119,850 |
| 2023 | $5,091 | $168,500 | $47,750 | $120,750 |
| 2022 | $4,935 | $158,000 | $47,750 | $110,250 |
| 2021 | $3,982 | $122,250 | $24,900 | $97,350 |
| 2020 | $3,818 | $116,950 | $24,900 | $92,050 |
| 2019 | $3,756 | $112,900 | $24,900 | $88,000 |
| 2018 | $3,640 | $114,700 | $24,900 | $89,800 |
| 2017 | $3,402 | $113,750 | $24,900 | $88,850 |
| 2016 | $3,051 | $114,850 | $24,900 | $89,950 |
| 2015 | $2,807 | $98,350 | $15,750 | $82,600 |
| 2014 | $2,609 | $85,350 | $15,750 | $69,600 |
| 2013 | $2,443 | $79,850 | $15,750 | $64,100 |
Source: Public Records
Map
Nearby Homes
- 3371 1st St
- 3755 Houkom Dr E
- 3662 N Sedona Ct
- 3830 3rd St E
- 3405 4th St E
- 436 35th Ave E
- 360 32nd Ave W Unit 608
- 360 32nd Ave W Unit 508
- 3037 Claire Dr E
- 414 Westview Ln E
- 3784 Bell Blvd E
- 6511 Osgood Pkwy S
- 421 Westview Ln E
- 3463 Loberg Dr
- 522 Westview Ln E
- 3767 Bell Blvd E
- 503 33rd Way E Unit B
- 909 38 1 2 Ave W
- 433 Foxtail Dr
- 2836 River's Bend Dr E
- 3501 Hidden Cir
- 116 36th Avenue Place E
- 3503 Hidden Cir
- 110 36th Avenue Place E
- 127 36th Avenue Place E
- 121 36th Avenue Place E
- 127 36th Avenue Place E
- 3505 Hidden Cir
- 3502 Hidden Way
- 115 36th Avenue Place E
- 204 36 1/2 Avenue Place E
- 3500 Hidden Cir
- 204 36 1 2 Avenue Place E
- 109 36th Avenue Place E
- 210 36 1 2 Avenue Place E
- 210 36 1/2 Avenue Place E
- 104 36th Avenue Place E
- 122 37th Ave E
- 126 37th Ave E
- 216 36 1/2 Avenue Place E