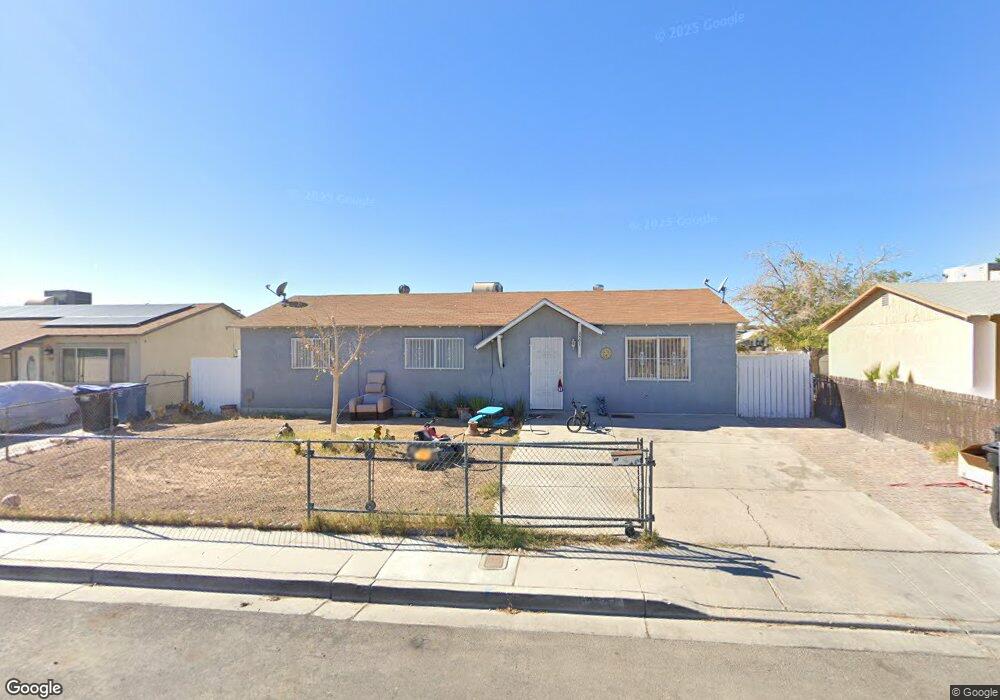
3501 Nipper St North Las Vegas, NV 89030
Estimated Value: $315,000 - $352,000
4
Beds
2
Baths
1,235
Sq Ft
$267/Sq Ft
Est. Value
About This Home
This home is located at 3501 Nipper St, North Las Vegas, NV 89030 and is currently estimated at $329,847, approximately $267 per square foot. 3501 Nipper St is a home located in Clark County with nearby schools including Lois Craig Elementary School, Marvin M Sedway Middle School, and Canyon Springs High School And The Leadership And.
Ownership History
Date
Name
Owned For
Owner Type
Purchase Details
Closed on
Jun 16, 2020
Sold by
Rodriguez Alfonso and Rodriguez Consuelo
Bought by
Rodriguez Alfonso and Rodriguez Consuelo
Current Estimated Value
Purchase Details
Closed on
May 22, 2012
Sold by
County Treasurer & Ex Officio Trustee Of
Bought by
Rodriguez Alfonso and Rodriguez Consuelo
Create a Home Valuation Report for This Property
The Home Valuation Report is an in-depth analysis detailing your home's value as well as a comparison with similar homes in the area
Home Values in the Area
Average Home Value in this Area
Purchase History
| Date | Buyer | Sale Price | Title Company |
|---|---|---|---|
| Rodriguez Alfonso | -- | None Available | |
| Rodriguez Alfonso | $37,000 | None Available |
Source: Public Records
Tax History Compared to Growth
Tax History
| Year | Tax Paid | Tax Assessment Tax Assessment Total Assessment is a certain percentage of the fair market value that is determined by local assessors to be the total taxable value of land and additions on the property. | Land | Improvement |
|---|---|---|---|---|
| 2025 | $611 | $40,100 | $24,500 | $15,600 |
| 2024 | $611 | $40,100 | $24,500 | $15,600 |
| 2023 | $641 | $41,410 | $27,300 | $14,110 |
| 2022 | $622 | $34,994 | $22,400 | $12,594 |
| 2021 | $603 | $29,217 | $17,500 | $11,717 |
| 2020 | $577 | $28,899 | $17,500 | $11,399 |
| 2019 | $541 | $25,634 | $14,000 | $11,634 |
| 2018 | $516 | $23,780 | $12,250 | $11,530 |
| 2017 | $756 | $22,533 | $10,500 | $12,033 |
| 2016 | $484 | $19,489 | $6,650 | $12,839 |
| 2015 | $483 | $14,270 | $3,850 | $10,420 |
| 2014 | $468 | $15,017 | $3,850 | $11,167 |
Source: Public Records
Map
Nearby Homes
- 3501 Orvis St
- 3508 Rio Robles Dr Unit D
- 3508 Rio Robles Dr Unit C
- 3508 Rio Robles Dr Unit A
- 3327 Rio Grande St
- 3540 Purdue
- 3630 Three Bars Ct
- 3429 E Cheyenne Ave
- 3401 N Walnut Rd Unit 330
- 3401 N Walnut Rd Unit 121
- 3401 N Walnut Rd Unit 113
- 3401 N Walnut Rd Unit 109
- 3401 N Walnut Rd Unit 388
- 3401 N Walnut Rd Unit 235
- 3401 N Walnut Rd Unit 15
- 3401 N Walnut Rd Unit 236
- 3401 N Walnut Rd Unit 74
- 3401 N Walnut Rd Unit 13
- 3401 N Walnut Rd Unit 6
- 3401 N Walnut Rd Unit 402
- 3505 Nipper St
- 3441 Nipper St
- 3440 Mabry St
- 3504 Mabry St
- 3436 Mabry St
- 3509 Nipper St
- 3500 Nipper St Unit 4
- 3508 Mabry St
- 3432 Mabry St
- 3504 Nipper St
- 3440 Nipper St
- 3515 Nipper St
- 3433 Nipper St
- 3508 Nipper St Unit 4
- 3512 Mabry St
- 3428 Mabry St
- 3400 Siler Ave
- 3512 Nipper St
- 3517 Nipper St
- 3441 Mabry St