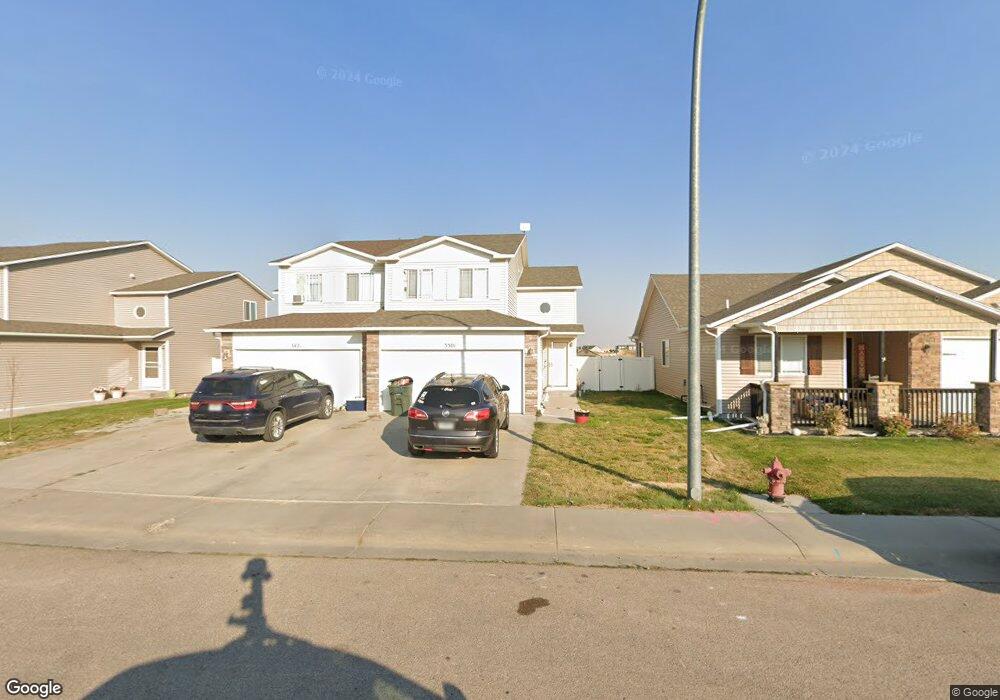
3501 Quacker Ave - Gillette, WY 82718
Estimated Value: $246,000 - $269,328
3
Beds
3
Baths
1,552
Sq Ft
$167/Sq Ft
Est. Value
About This Home
This home is located at 3501 Quacker Ave -, Gillette, WY 82718 and is currently estimated at $258,443, approximately $166 per square foot. 3501 Quacker Ave - is a home located in Campbell County with nearby schools including Westwood High School, Sunflower Elementary School, and Sage Valley Junior High School.
Ownership History
Date
Name
Owned For
Owner Type
Purchase Details
Closed on
Aug 29, 2025
Sold by
Roberts Tiffany J
Bought by
Hansen Susan
Current Estimated Value
Purchase Details
Closed on
Jul 20, 2022
Sold by
Trujillo Iii Silviano A and Trujillo Cindy N
Bought by
Roberts Tiffany J
Home Financials for this Owner
Home Financials are based on the most recent Mortgage that was taken out on this home.
Original Mortgage
$212,121
Interest Rate
5.81%
Mortgage Type
New Conventional
Purchase Details
Closed on
Jul 14, 2015
Sold by
Wyoming Community Development Authority
Bought by
Golden Development Llc
Purchase Details
Closed on
May 19, 2009
Sold by
Monument Homebuilders Inc
Bought by
Manzanarez Micah
Home Financials for this Owner
Home Financials are based on the most recent Mortgage that was taken out on this home.
Original Mortgage
$172,346
Interest Rate
4.84%
Mortgage Type
New Conventional
Create a Home Valuation Report for This Property
The Home Valuation Report is an in-depth analysis detailing your home's value as well as a comparison with similar homes in the area
Home Values in the Area
Average Home Value in this Area
Purchase History
| Date | Buyer | Sale Price | Title Company |
|---|---|---|---|
| Hansen Susan | -- | None Listed On Document | |
| Roberts Tiffany J | -- | None Listed On Document | |
| Golden Development Llc | -- | None Available | |
| Manzanarez Micah | -- | None Available |
Source: Public Records
Mortgage History
| Date | Status | Borrower | Loan Amount |
|---|---|---|---|
| Previous Owner | Roberts Tiffany J | $212,121 | |
| Previous Owner | Manzanarez Micah | $172,346 |
Source: Public Records
Tax History Compared to Growth
Tax History
| Year | Tax Paid | Tax Assessment Tax Assessment Total Assessment is a certain percentage of the fair market value that is determined by local assessors to be the total taxable value of land and additions on the property. | Land | Improvement |
|---|---|---|---|---|
| 2025 | $1,308 | $14,510 | $2,829 | $11,681 |
| 2024 | $1,308 | $18,603 | $3,627 | $14,976 |
| 2023 | $1,268 | $18,027 | $3,627 | $14,400 |
| 2022 | $1,131 | $16,027 | $2,962 | $13,065 |
| 2021 | $0 | $14,385 | $2,962 | $11,423 |
| 2020 | $961 | $14,126 | $2,962 | $11,164 |
| 2019 | $962 | $14,169 | $2,962 | $11,207 |
| 2018 | $939 | $13,887 | $2,962 | $10,925 |
| 2017 | $967 | $14,328 | $3,040 | $11,288 |
| 2016 | $1,029 | $15,229 | $3,040 | $12,189 |
| 2015 | -- | $14,336 | $3,040 | $11,296 |
| 2014 | -- | $13,793 | $3,040 | $10,753 |
Source: Public Records
Map
Nearby Homes
- 3501 Quacker Ave
- 3421 Quacker Ave
- 3503 Quacker Ave
- 3419 Quacker Ave
- 3417 Quacker Ave
- 3415 Quacker Ave
- 3505 Quacker Ave
- 3420 Quacker Ave
- 3413 Quacker Ave
- 3418 Quacker Ave
- 3416 Quacker Ave
- 1312 Muscovy Dr
- 3411 Quacker Ave
- 3414 Quacker Ave
- 3412 Quacker Ave
- 3409 Quacker Ave
- 3410 Quacker Ave
- 1310 Muscovy Dr
- 3407 Quacker Ave
- 3421 Decoy Ave