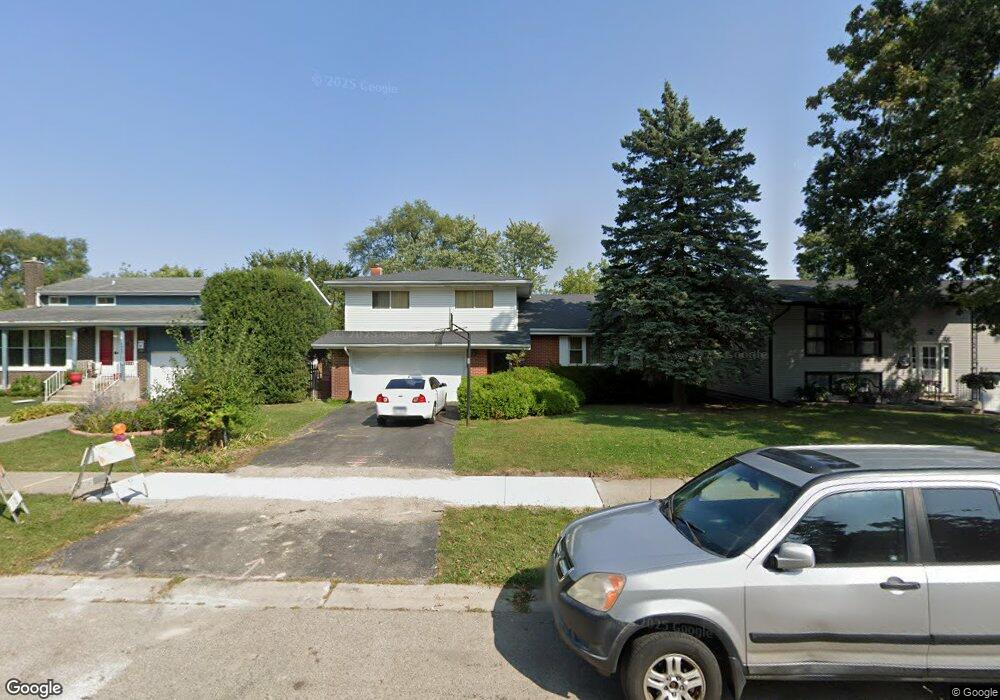
3501 Stonegate Rd Waukegan, IL 60087
Estimated Value: $283,000 - $328,000
3
Beds
3
Baths
1,440
Sq Ft
$211/Sq Ft
Est. Value
About This Home
This home is located at 3501 Stonegate Rd, Waukegan, IL 60087 and is currently estimated at $303,582, approximately $210 per square foot. 3501 Stonegate Rd is a home located in Lake County with nearby schools including H R McCall Elementary School, Jack Benny Middle School, and Waukegan High School.
Ownership History
Date
Name
Owned For
Owner Type
Purchase Details
Closed on
Jul 10, 2006
Sold by
Snyder Dion and Snyder Amy
Bought by
Yarber Daryl and Dickerson Judy
Current Estimated Value
Home Financials for this Owner
Home Financials are based on the most recent Mortgage that was taken out on this home.
Original Mortgage
$164,000
Outstanding Balance
$106,404
Interest Rate
8.5%
Mortgage Type
Purchase Money Mortgage
Estimated Equity
$197,178
Purchase Details
Closed on
Jun 26, 2003
Sold by
Yim Chung Diem and Yim Anita P
Bought by
Snyder Dion and Snyder Amy
Home Financials for this Owner
Home Financials are based on the most recent Mortgage that was taken out on this home.
Original Mortgage
$176,450
Interest Rate
5.47%
Mortgage Type
VA
Purchase Details
Closed on
Jul 29, 1996
Sold by
Wade Harold P and Wade Wanda J
Bought by
Yim Chung Diem and Yim Anita P
Home Financials for this Owner
Home Financials are based on the most recent Mortgage that was taken out on this home.
Original Mortgage
$110,160
Interest Rate
8.43%
Mortgage Type
VA
Create a Home Valuation Report for This Property
The Home Valuation Report is an in-depth analysis detailing your home's value as well as a comparison with similar homes in the area
Home Values in the Area
Average Home Value in this Area
Purchase History
| Date | Buyer | Sale Price | Title Company |
|---|---|---|---|
| Yarber Daryl | $205,000 | Nat | |
| Snyder Dion | $173,000 | Stewart Title Guaranty Compa | |
| Yim Chung Diem | $108,000 | -- |
Source: Public Records
Mortgage History
| Date | Status | Borrower | Loan Amount |
|---|---|---|---|
| Open | Yarber Daryl | $164,000 | |
| Previous Owner | Snyder Dion | $176,450 | |
| Previous Owner | Yim Chung Diem | $110,160 |
Source: Public Records
Tax History Compared to Growth
Tax History
| Year | Tax Paid | Tax Assessment Tax Assessment Total Assessment is a certain percentage of the fair market value that is determined by local assessors to be the total taxable value of land and additions on the property. | Land | Improvement |
|---|---|---|---|---|
| 2024 | $6,132 | $76,431 | $6,546 | $69,885 |
| 2023 | $6,132 | $73,782 | $6,319 | $67,463 |
| 2022 | $5,951 | $67,603 | $6,182 | $61,421 |
| 2021 | $5,094 | $55,495 | $6,025 | $49,470 |
| 2020 | $5,250 | $52,959 | $5,750 | $47,209 |
| 2019 | $5,443 | $50,245 | $5,455 | $44,790 |
| 2018 | $4,755 | $42,431 | $6,600 | $35,831 |
| 2017 | $4,746 | $39,916 | $6,209 | $33,707 |
| 2016 | $4,858 | $38,001 | $5,911 | $32,090 |
| 2015 | $4,783 | $34,851 | $5,421 | $29,430 |
| 2014 | $5,511 | $40,434 | $9,134 | $31,300 |
| 2012 | $6,355 | $42,018 | $9,492 | $32,526 |
Source: Public Records
Map
Nearby Homes
- 3411 N Lewis Ave
- 37966 N Cornell Rd
- 1730 W Beach Rd
- 3211 Rugby Ct
- 38127 N Shore Ave
- 38683 N Lewis Ave
- 38362 N Manor Ave
- 37905 N Loyola Ave
- 38697 N Cedar Ave
- 1636 Rice St
- 11345 W Carnahan Ave
- 3101 Country Club Ln
- 11342-11364 W Wadsworth Rd
- 1612 Whitney St
- 2613 N Lewis Ave
- 2625 Vercoe Ave
- 12582 W Beach Rd
- 12312 W Audrey Ave
- 38859 N Green Bay Rd
- 10241 W Bairstow Ave
- 3505 Stonegate Rd
- 3437 Stonegate Rd
- 3433 Stonegate Rd
- 3509 Stonegate Rd
- 3513 Stonegate Rd
- 3429 Stonegate Rd Unit 1
- 3500 Stonegate Rd
- 3510 Stonegate Rd
- 3433 N Lewis Ave
- 3433 N Lewis Ave
- 3501 N Lewis Ave
- 3430 Stonegate Rd
- 3517 Stonegate Rd
- 3425 Stonegate Rd
- 3429 N Lewis Ave
- 3509 N Lewis Ave
- 1913 Irving Pkwy
- 3425 N Lewis Ave
- 1915 Arthur Dr
- 3521 Stonegate Rd