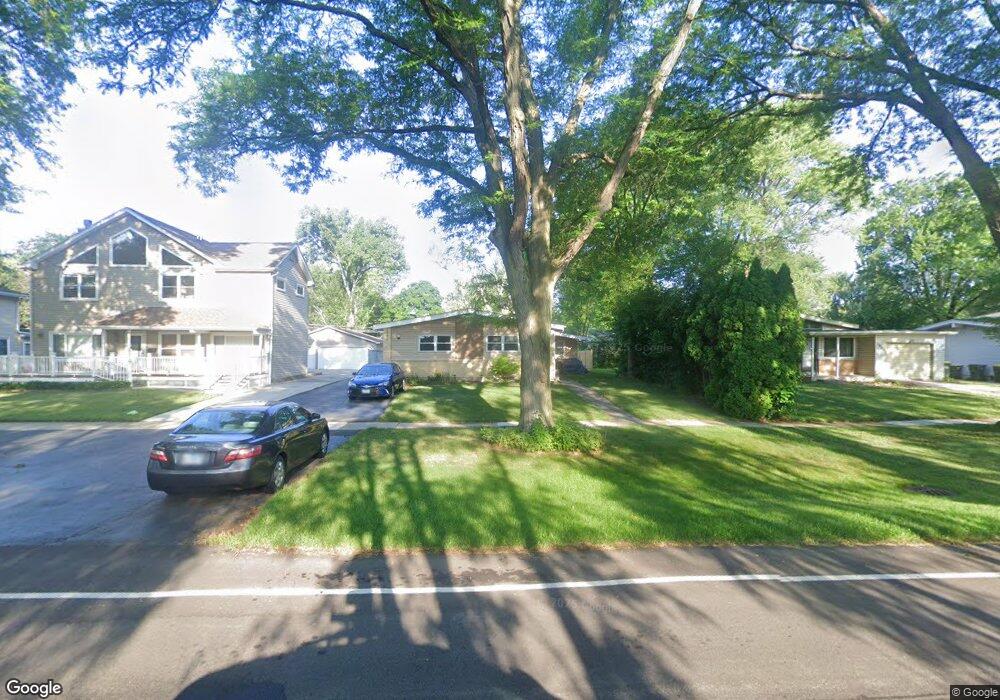
3501 Wilke Rd Rolling Meadows, IL 60008
Estimated Value: $330,476 - $392,000
3
Beds
1
Bath
1,080
Sq Ft
$328/Sq Ft
Est. Value
About This Home
This home is located at 3501 Wilke Rd, Rolling Meadows, IL 60008 and is currently estimated at $354,619, approximately $328 per square foot. 3501 Wilke Rd is a home located in Cook County with nearby schools including Kimball Hill Elementary School, Carl Sandburg Junior High School, and Rolling Meadows High School.
Ownership History
Date
Name
Owned For
Owner Type
Purchase Details
Closed on
Mar 26, 2002
Sold by
Cornelius Lavina J
Bought by
Jelev Vesselin and Jeleva Mariana
Current Estimated Value
Home Financials for this Owner
Home Financials are based on the most recent Mortgage that was taken out on this home.
Original Mortgage
$201,760
Outstanding Balance
$80,943
Interest Rate
6.93%
Estimated Equity
$273,676
Purchase Details
Closed on
Mar 21, 2001
Sold by
Cornelius Lavina
Bought by
Cornelius Lavina J
Home Financials for this Owner
Home Financials are based on the most recent Mortgage that was taken out on this home.
Original Mortgage
$180,000
Interest Rate
7.18%
Purchase Details
Closed on
Mar 20, 1998
Sold by
Cornelius Amit C
Bought by
Cornelius Lavina
Create a Home Valuation Report for This Property
The Home Valuation Report is an in-depth analysis detailing your home's value as well as a comparison with similar homes in the area
Home Values in the Area
Average Home Value in this Area
Purchase History
| Date | Buyer | Sale Price | Title Company |
|---|---|---|---|
| Jelev Vesselin | $208,000 | Chicago Title Insurance Co | |
| Cornelius Lavina J | -- | Prairie Title | |
| Cornelius Lavina | -- | Absolute Title Services Inc |
Source: Public Records
Mortgage History
| Date | Status | Borrower | Loan Amount |
|---|---|---|---|
| Open | Jelev Vesselin | $201,760 | |
| Previous Owner | Cornelius Lavina J | $180,000 |
Source: Public Records
Tax History
| Year | Tax Paid | Tax Assessment Tax Assessment Total Assessment is a certain percentage of the fair market value that is determined by local assessors to be the total taxable value of land and additions on the property. | Land | Improvement |
|---|---|---|---|---|
| 2025 | $6,038 | $31,000 | $5,070 | $25,930 |
| 2024 | $6,038 | $21,052 | $4,290 | $16,762 |
| 2023 | $5,752 | $23,018 | $4,290 | $18,728 |
| 2022 | $5,752 | $23,018 | $4,290 | $18,728 |
| 2021 | $4,619 | $17,277 | $2,535 | $14,742 |
| 2020 | $4,832 | $18,044 | $2,535 | $15,509 |
| 2019 | $4,868 | $20,161 | $2,535 | $17,626 |
| 2018 | $4,591 | $17,611 | $2,340 | $15,271 |
| 2017 | $4,976 | $19,056 | $2,340 | $16,716 |
| 2016 | $4,895 | $19,056 | $2,340 | $16,716 |
| 2015 | $4,066 | $15,537 | $2,145 | $13,392 |
| 2014 | $3,986 | $15,537 | $2,145 | $13,392 |
| 2013 | $4,647 | $18,122 | $2,145 | $15,977 |
Source: Public Records
Map
Nearby Homes
- 3717 Oriole Ln
- 2201 Kingfisher Ln
- 2109 Park St
- 2404 Hawk Ln
- 1317 W Grove St
- 2308 Park St
- 811 S Dwyer Ave Unit E
- 1107 W Francis Dr
- 837 S Dwyer Ave Unit A
- 2808 Dove St
- 1107 S Old Wilke Rd Unit 103
- 1107 S Old Wilke Rd Unit 208
- 1117 S Old Wilke Rd Unit 206
- 2720 Lily Ln
- 3306 Trillium Cir Unit 3001
- 2503 George St
- 3101 Thrush Ln
- 3200 Thrush Ln
- 3100 Town Square Dr Unit 308
- 3610 Pheasant Dr
Your Personal Tour Guide
Ask me questions while you tour the home.