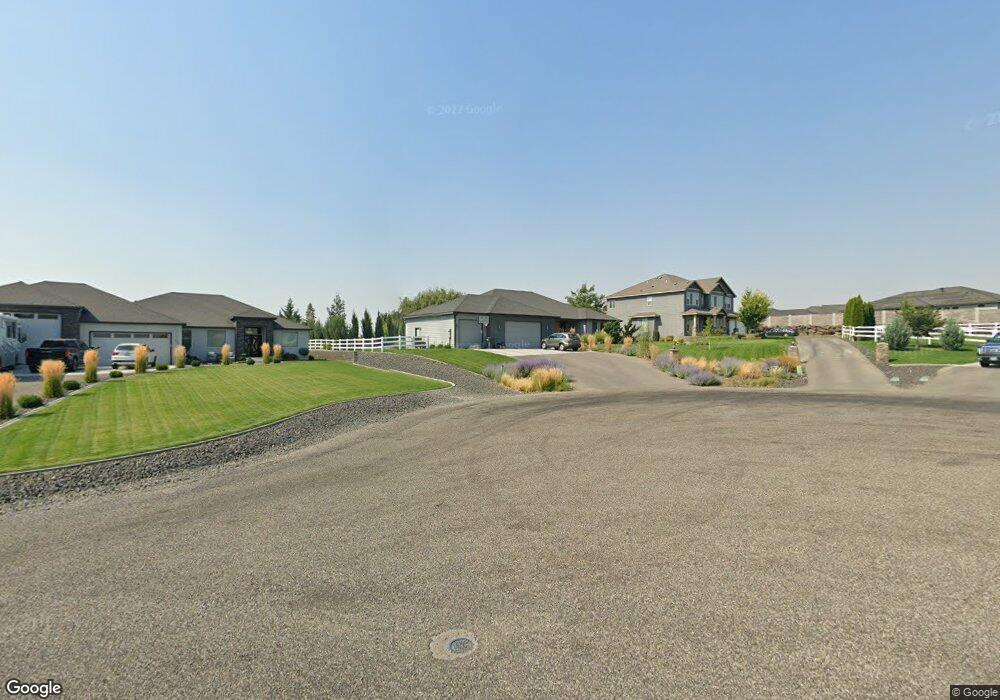
3502 N Levi Ct Unit VIEW in Hidden Hills Kennewick, WA 99338
Estimated Value: $668,000 - $789,000
3
Beds
2
Baths
2,303
Sq Ft
$313/Sq Ft
Est. Value
About This Home
This home is located at 3502 N Levi Ct Unit VIEW in Hidden Hills, Kennewick, WA 99338 and is currently estimated at $719,755, approximately $312 per square foot. 3502 N Levi Ct Unit VIEW in Hidden Hills is a home located in Benton County with nearby schools including Orchard Elementary School, Enterprise Middle School, and Richland High School.
Ownership History
Date
Name
Owned For
Owner Type
Purchase Details
Closed on
Oct 25, 2018
Sold by
Bradbury Randy and Bradbury Denice
Bought by
Patterson Maathew and Patterson Erin
Current Estimated Value
Home Financials for this Owner
Home Financials are based on the most recent Mortgage that was taken out on this home.
Original Mortgage
$313,000
Outstanding Balance
$274,089
Interest Rate
4.6%
Mortgage Type
New Conventional
Estimated Equity
$445,666
Purchase Details
Closed on
Apr 21, 2016
Sold by
Harris Derrick and Harris Ashley
Bought by
Bruce Denice B and Bradbury Randy Lamar
Home Financials for this Owner
Home Financials are based on the most recent Mortgage that was taken out on this home.
Original Mortgage
$377,150
Interest Rate
3.68%
Mortgage Type
New Conventional
Create a Home Valuation Report for This Property
The Home Valuation Report is an in-depth analysis detailing your home's value as well as a comparison with similar homes in the area
Home Values in the Area
Average Home Value in this Area
Purchase History
| Date | Buyer | Sale Price | Title Company |
|---|---|---|---|
| Patterson Maathew | $433,000 | Cascade Title Co | |
| Bruce Denice B | $397,000 | Stewart Title Company |
Source: Public Records
Mortgage History
| Date | Status | Borrower | Loan Amount |
|---|---|---|---|
| Open | Patterson Maathew | $313,000 | |
| Previous Owner | Bruce Denice B | $377,150 |
Source: Public Records
Tax History Compared to Growth
Tax History
| Year | Tax Paid | Tax Assessment Tax Assessment Total Assessment is a certain percentage of the fair market value that is determined by local assessors to be the total taxable value of land and additions on the property. | Land | Improvement |
|---|---|---|---|---|
| 2024 | $6,218 | $601,040 | $120,000 | $481,040 |
| 2023 | $6,218 | $622,910 | $120,000 | $502,910 |
| 2022 | $5,393 | $490,700 | $75,000 | $415,700 |
| 2021 | $4,987 | $454,020 | $75,000 | $379,020 |
| 2020 | $5,091 | $405,120 | $75,000 | $330,120 |
| 2019 | $4,238 | $392,890 | $75,000 | $317,890 |
| 2018 | $4,486 | $356,210 | $75,000 | $281,210 |
| 2017 | $4,119 | $319,530 | $75,000 | $244,530 |
| 2016 | $4,092 | $330,980 | $58,800 | $272,180 |
| 2015 | $3,324 | $330,980 | $58,800 | $272,180 |
| 2014 | -- | $263,610 | $58,800 | $204,810 |
| 2013 | -- | $24,400 | $24,400 | $0 |
Source: Public Records
Map
Nearby Homes
- 671 Cortona Way
- 4127 N Clover Rd
- 2372 Upriver Ave Unit Lot4
- 670 Cortona Way Unit 39
- 2379 Upriver Ave
- 678 Cortona Way
- 2340 Upriver Ave
- 1254 N Bermuda Rd
- 588 Lazio Way
- 4170 N Clover Rd
- 2370 Waterhill Ave Unit 44
- Cascade Plan at Siena Hills
- Siena Plan at Siena Hills
- Messina XL Plan at Siena Hills
- Camas Plan at Siena Hills
- Venetia Plan at Siena Hills
- Lincoln Plan at Siena Hills
- Olympia Plan at Siena Hills
- Trenton Plan at Siena Hills
- 2354 Waterhill Ave
- 3502 N Levi Ct
- 3502 N Levi Ct Unit Contemporary Custom
- 3502 N Levi Ct Unit Hidden Hills!
- 3606 N Levi Ct
- 3404 N Levi Ct
- 3704 N Levi Ct
- 3104 N Levi St
- 3104 N Levi St Unit Beautiful New Titan
- 3619 N Clover Rd
- 3619 N Clover Rd
- 3215 N Clover Rd
- 4159 N Clover Rd
- 3417 N Clover Rd
- 3821 N Clover Rd
- 94816 E Holly Rd Unit Incredible Outdoor L
- 94816 E Holly Rd Unit Country Setting Home
- 94816 E Holly Rd
- 3802 N Levi St
- 2468 Maggio Loop Unit Lot18
- 2489 Maggio Loop Unit Lot40