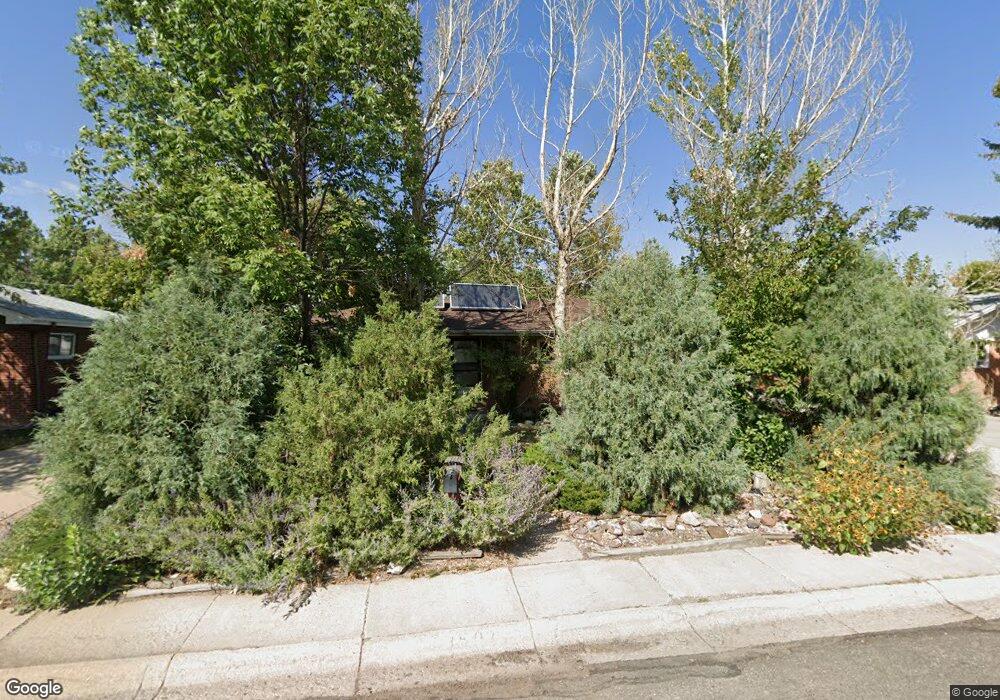
3502 Randy Rd Cheyenne, WY 82001
Estimated Value: $336,000 - $362,000
--
Bed
1
Bath
1,155
Sq Ft
$303/Sq Ft
Est. Value
About This Home
This home is located at 3502 Randy Rd, Cheyenne, WY 82001 and is currently estimated at $349,572, approximately $302 per square foot. 3502 Randy Rd is a home located in Laramie County with nearby schools including Baggs Elementary School, Carey Junior High School, and East High School.
Ownership History
Date
Name
Owned For
Owner Type
Purchase Details
Closed on
Jul 24, 2024
Sold by
Mccahan Mary Janette
Bought by
Dafoe Robin and Dafoe Jessie
Current Estimated Value
Purchase Details
Closed on
Feb 22, 2005
Sold by
Siglin Daniel L and Siglin Dianne L
Bought by
Hastings Michael J
Home Financials for this Owner
Home Financials are based on the most recent Mortgage that was taken out on this home.
Original Mortgage
$112,500
Interest Rate
5.77%
Mortgage Type
Purchase Money Mortgage
Purchase Details
Closed on
Nov 30, 1999
Sold by
Bales Nancy A
Bought by
Siglin Daniel L and Siglin Dianne L
Home Financials for this Owner
Home Financials are based on the most recent Mortgage that was taken out on this home.
Original Mortgage
$107,250
Interest Rate
7.93%
Create a Home Valuation Report for This Property
The Home Valuation Report is an in-depth analysis detailing your home's value as well as a comparison with similar homes in the area
Home Values in the Area
Average Home Value in this Area
Purchase History
| Date | Buyer | Sale Price | Title Company |
|---|---|---|---|
| Dafoe Robin | -- | First American | |
| Hastings Michael J | -- | -- | |
| Siglin Daniel L | -- | -- |
Source: Public Records
Mortgage History
| Date | Status | Borrower | Loan Amount |
|---|---|---|---|
| Previous Owner | Hastings Michael J | $112,500 | |
| Previous Owner | Siglin Daniel L | $107,250 |
Source: Public Records
Tax History Compared to Growth
Tax History
| Year | Tax Paid | Tax Assessment Tax Assessment Total Assessment is a certain percentage of the fair market value that is determined by local assessors to be the total taxable value of land and additions on the property. | Land | Improvement |
|---|---|---|---|---|
| 2025 | $2,111 | $23,334 | $3,513 | $19,821 |
| 2024 | $2,111 | $29,852 | $4,684 | $25,168 |
| 2023 | $2,046 | $28,939 | $4,684 | $24,255 |
| 2022 | $1,901 | $26,337 | $4,684 | $21,653 |
| 2021 | $1,671 | $23,102 | $4,684 | $18,418 |
| 2020 | $1,581 | $21,922 | $4,684 | $17,238 |
| 2019 | $1,447 | $20,048 | $4,684 | $15,364 |
| 2018 | $1,362 | $19,041 | $4,032 | $15,009 |
| 2017 | $1,364 | $18,900 | $2,987 | $15,913 |
| 2016 | $1,296 | $17,944 | $2,785 | $15,159 |
| 2015 | $1,209 | $16,741 | $2,785 | $13,956 |
| 2014 | $1,197 | $16,465 | $2,785 | $13,680 |
Source: Public Records
Map
Nearby Homes
- 2334 Mccann Ave Unit 56
- 3251 Fir Dr
- 3429 E 12th St
- 1426 Adams Ave
- TBD Atkin St
- 3428 E 11th St
- Proposed Lot 3 Ridge Rd
- Proposed Lot 2 Ridge Rd
- Proposed Lot 4 Ridge Rd
- 1442 Monroe Ct
- 3315 Grove Dr
- 3241 Acacia Dr
- 3248 Acacia Dr
- Lot 2 E 13th St
- 1301 Diamond Ave
- 3820 E Pershing Blvd
- 3820 E Pershing Blvd
- 3331 Belaire Ave
- 3207 Cheyenne St
- Lot 1 Block 2 N College Dr
- 3418 Randy Rd
- 3508 Randy Rd
- 3503 Frontier St
- 3425 Frontier St
- 3412 Randy Rd
- 3512 Randy Rd
- 3509 Frontier St
- 3419 Frontier St
- 3503 Randy Rd
- 3425 Randy Rd
- 3509 Randy Rd
- 3419 Randy Rd
- 3513 Frontier St
- 3413 Frontier St
- 3408 Randy Rd
- 3518 Randy Rd
- 3513 Randy Rd
- 3413 Randy Rd
- 3519 Frontier St
- 3524 Randy Rd