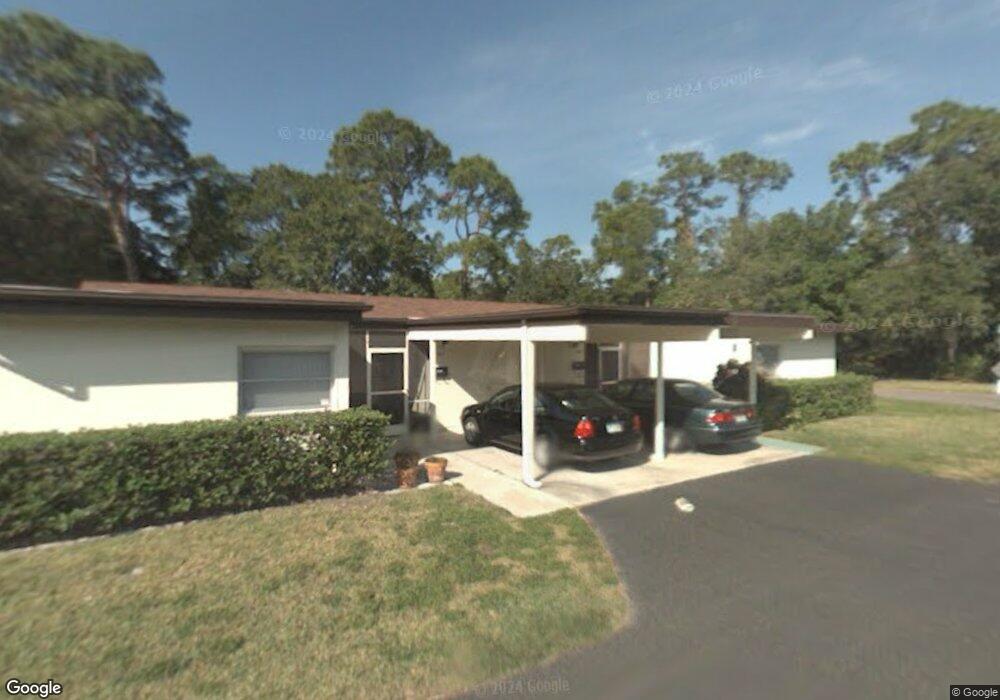
3502 Tree Line Ct Unit 32 Sarasota, FL 34231
Estimated Value: $170,923 - $253,000
2
Beds
2
Baths
1,225
Sq Ft
$169/Sq Ft
Est. Value
About This Home
This home is located at 3502 Tree Line Ct Unit 32, Sarasota, FL 34231 and is currently estimated at $207,231, approximately $169 per square foot. 3502 Tree Line Ct Unit 32 is a home located in Sarasota County with nearby schools including Gulf Gate Elementary School, Riverview High School, and Brookside Middle School.
Ownership History
Date
Name
Owned For
Owner Type
Purchase Details
Closed on
Aug 13, 2024
Sold by
Juceam Allison D
Bought by
Dayan Sylvia G and Juceam Allison D
Current Estimated Value
Purchase Details
Closed on
Jun 5, 2019
Sold by
Dayan Sylvia G
Bought by
Juceam Allison D
Purchase Details
Closed on
Jun 14, 2012
Sold by
Dayan Sylvia G
Bought by
Dayan Sylvia G and Juceam Allison D
Purchase Details
Closed on
Aug 1, 2008
Sold by
Haber Margaret
Bought by
Dayan Sylvia
Purchase Details
Closed on
Mar 12, 2001
Sold by
Shope Mary Ellen
Bought by
Haber Margaret
Purchase Details
Closed on
Dec 18, 2000
Sold by
Huff Mildred B and Hoff Fredrick J
Bought by
Shope Mary Ellen
Home Financials for this Owner
Home Financials are based on the most recent Mortgage that was taken out on this home.
Original Mortgage
$66,500
Interest Rate
7.79%
Mortgage Type
Purchase Money Mortgage
Create a Home Valuation Report for This Property
The Home Valuation Report is an in-depth analysis detailing your home's value as well as a comparison with similar homes in the area
Home Values in the Area
Average Home Value in this Area
Purchase History
| Date | Buyer | Sale Price | Title Company |
|---|---|---|---|
| Dayan Sylvia G | $100 | None Listed On Document | |
| Juceam Allison D | -- | Attorney | |
| Dayan Sylvia G | -- | Attorney | |
| Dayan Sylvia | $99,000 | Attorney | |
| Haber Margaret | -- | -- | |
| Shope Mary Ellen | $70,000 | -- |
Source: Public Records
Mortgage History
| Date | Status | Borrower | Loan Amount |
|---|---|---|---|
| Previous Owner | Shope Mary Ellen | $66,500 |
Source: Public Records
Tax History Compared to Growth
Tax History
| Year | Tax Paid | Tax Assessment Tax Assessment Total Assessment is a certain percentage of the fair market value that is determined by local assessors to be the total taxable value of land and additions on the property. | Land | Improvement |
|---|---|---|---|---|
| 2024 | $2,432 | $151,988 | -- | -- |
| 2023 | $2,432 | $200,700 | $0 | $200,700 |
| 2022 | $2,263 | $182,000 | $0 | $182,000 |
| 2021 | $1,700 | $106,100 | $0 | $106,100 |
| 2020 | $1,666 | $102,200 | $0 | $102,200 |
| 2019 | $689 | $52,921 | $0 | $0 |
| 2018 | $638 | $51,934 | $0 | $0 |
| 2017 | $619 | $49,112 | $0 | $0 |
| 2016 | $604 | $86,000 | $0 | $86,000 |
| 2015 | $589 | $71,300 | $0 | $71,300 |
| 2014 | $585 | $45,309 | $0 | $0 |
Source: Public Records
Map
Nearby Homes
- 3538 Silver Pine Ct Unit 87
- 6201 Green View Dr Unit 130
- 6124 Green View Dr Unit 139
- 6213 Green View Dr Unit 127
- 6146 Rockefeller Ave
- 3500 N Village Ct Unit 221
- 5948 Mirror Lake Rd
- 3312 Kenmore Dr
- 3639 Beneva Oaks Blvd
- 3632 Beneva Oaks Blvd
- 3405 Clark Rd Unit 205
- 3403 Clark Rd Unit 203
- 3310 Lexington St
- 3274 Savage Rd
- 3825 Wilshire Cir Unit 1
- 3413 Clark Rd Unit 114
- 3411 Clark Rd Unit 212
- 3648 Beneva Oaks Blvd
- 3423 Clark Rd Unit 124
- 6717 Roxbury Dr
- 6287 Green View Cir Unit 101
- 3533 Tree Line Ct Unit 13
- 6259 Green View Cir Unit 108
- 6208 Green View Cir Unit 59
- 3540 Tree Line Ct Unit 23
- 3541 Tree Line Ct Unit 16
- 6232 Green View Cir Unit 66
- 3501 Tree Line Ct Unit 9
- 3525 Green View Ct Unit 37
- 6248 Green View Cir Unit 98
- 6221 Green View Dr Unit 125
- 3529 Green View Ct Unit 36
- 6223 Green View Cir Unit 76
- 6271 Green View Cir Unit 105
- 3546 Tree Line Ct Unit 21
- 6104 Green View Dr Unit 144
- 6145 Green View Dr Unit 134
- 6219 Green View Cir Unit 75
- 6264 Green View Cir Unit 112
- 6244 Green View Cir Unit 96