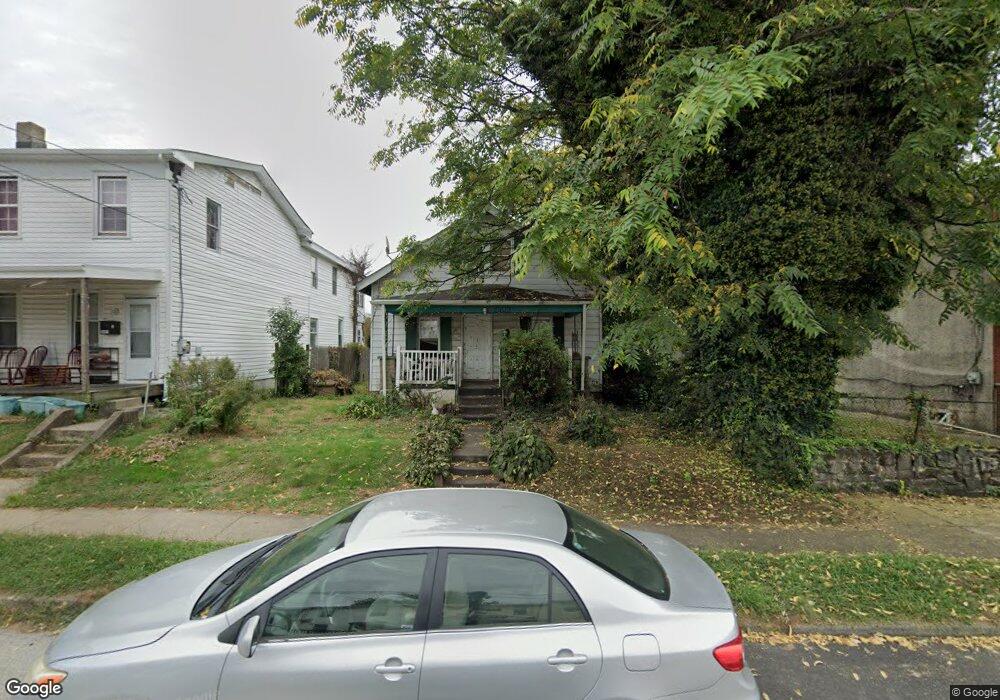
3503 W 3rd St Marcus Hook, PA 19061
Estimated Value: $183,000 - $222,000
3
Beds
1
Bath
1,225
Sq Ft
$164/Sq Ft
Est. Value
About This Home
This home is located at 3503 W 3rd St, Marcus Hook, PA 19061 and is currently estimated at $201,148, approximately $164 per square foot. 3503 W 3rd St is a home located in Delaware County with nearby schools including Chichester Senior High School, Chester Charter School for the Arts, and Frederick Douglass Christian School.
Ownership History
Date
Name
Owned For
Owner Type
Purchase Details
Closed on
Aug 2, 2007
Sold by
Timmes Gary
Bought by
Spisak Marc
Current Estimated Value
Home Financials for this Owner
Home Financials are based on the most recent Mortgage that was taken out on this home.
Original Mortgage
$100,000
Outstanding Balance
$63,541
Interest Rate
6.73%
Mortgage Type
Purchase Money Mortgage
Estimated Equity
$137,607
Purchase Details
Closed on
Feb 7, 2004
Sold by
Bankers Trust Co Of California Na
Bought by
Timmes Gary
Purchase Details
Closed on
Feb 23, 1995
Sold by
Va
Bought by
Bankers Trust Company Of California Na and Vendee Mtg Trust 1995-1
Create a Home Valuation Report for This Property
The Home Valuation Report is an in-depth analysis detailing your home's value as well as a comparison with similar homes in the area
Home Values in the Area
Average Home Value in this Area
Purchase History
| Date | Buyer | Sale Price | Title Company |
|---|---|---|---|
| Spisak Marc | $125,000 | Commonwealth Land Title Insu | |
| Timmes Gary | $38,900 | -- | |
| Bankers Trust Company Of California Na | $45,075 | -- |
Source: Public Records
Mortgage History
| Date | Status | Borrower | Loan Amount |
|---|---|---|---|
| Open | Spisak Marc | $100,000 |
Source: Public Records
Tax History Compared to Growth
Tax History
| Year | Tax Paid | Tax Assessment Tax Assessment Total Assessment is a certain percentage of the fair market value that is determined by local assessors to be the total taxable value of land and additions on the property. | Land | Improvement |
|---|---|---|---|---|
| 2025 | $2,321 | $59,010 | $22,460 | $36,550 |
| 2024 | $2,321 | $59,010 | $22,460 | $36,550 |
| 2023 | $2,259 | $59,010 | $22,460 | $36,550 |
| 2022 | $2,212 | $59,010 | $22,460 | $36,550 |
| 2021 | $3,122 | $59,010 | $22,460 | $36,550 |
| 2020 | $2,875 | $47,870 | $22,030 | $25,840 |
| 2019 | $2,875 | $47,870 | $22,030 | $25,840 |
| 2018 | $2,882 | $47,870 | $0 | $0 |
| 2017 | $2,863 | $47,870 | $0 | $0 |
| 2016 | $263 | $47,870 | $0 | $0 |
| 2015 | $268 | $47,870 | $0 | $0 |
| 2014 | $263 | $47,870 | $0 | $0 |
Source: Public Records
Map
Nearby Homes
- 3427 W 3rd St
- 0 Price St
- 3004 W 6th St
- 3000 W 6th St
- 2821 W 3rd St
- 4230 Post Rd
- 103 Thurlow St Unit 306
- 408 Highland Ave
- 4216 W 7th St
- 1001 Sunset St
- 424 Highland Ave
- 426 Highland Ave
- 1004 Sunset St
- 924 Chestnut St
- 321 Highland Ave
- 103 Highland Ave
- 2704 W 4th St
- 1150 Pine Ln
- 4412 Post Rd
- 2630 W 6th St