3504 Big Timber Ln Granbury, TX 76049
Estimated Value: $364,931 - $557,000
--
Bed
--
Bath
2,099
Sq Ft
$227/Sq Ft
Est. Value
About This Home
This home is located at 3504 Big Timber Ln, Granbury, TX 76049 and is currently estimated at $477,483, approximately $227 per square foot. 3504 Big Timber Ln is a home located in Hood County with nearby schools including Acton Elementary School, Acton Middle School, and Granbury High School.
Ownership History
Date
Name
Owned For
Owner Type
Purchase Details
Closed on
Aug 4, 2005
Sold by
Mearstone Properties Lp
Bought by
Stone Samuel C and Stone Teresa Garrett
Current Estimated Value
Home Financials for this Owner
Home Financials are based on the most recent Mortgage that was taken out on this home.
Original Mortgage
$173,850
Outstanding Balance
$89,871
Interest Rate
5.51%
Mortgage Type
New Conventional
Estimated Equity
$387,612
Purchase Details
Closed on
Jul 12, 2004
Sold by
Metronorth Development Inc
Bought by
Stone Samuel C and Stone Teresa Garrett
Purchase Details
Closed on
Apr 22, 2004
Sold by
Granbury Timber Cove Partners Ltd
Bought by
Stone Samuel C and Stone Teresa Garrett
Purchase Details
Closed on
Jun 8, 2000
Sold by
Henson Jerry M and Henson Betty L
Bought by
Stone Samuel C and Stone Teresa Garrett
Purchase Details
Closed on
Sep 15, 1998
Bought by
Stone Samuel C and Stone Teresa Garrett
Create a Home Valuation Report for This Property
The Home Valuation Report is an in-depth analysis detailing your home's value as well as a comparison with similar homes in the area
Home Values in the Area
Average Home Value in this Area
Purchase History
| Date | Buyer | Sale Price | Title Company |
|---|---|---|---|
| Stone Samuel C | -- | None Available | |
| Stone Samuel C | -- | -- | |
| Stone Samuel C | -- | -- | |
| Stone Samuel C | -- | -- | |
| Stone Samuel C | -- | -- |
Source: Public Records
Mortgage History
| Date | Status | Borrower | Loan Amount |
|---|---|---|---|
| Open | Stone Samuel C | $173,850 |
Source: Public Records
Tax History Compared to Growth
Tax History
| Year | Tax Paid | Tax Assessment Tax Assessment Total Assessment is a certain percentage of the fair market value that is determined by local assessors to be the total taxable value of land and additions on the property. | Land | Improvement |
|---|---|---|---|---|
| 2025 | $3,907 | $419,584 | $40,000 | $422,930 |
| 2024 | $3,613 | $381,440 | $40,000 | $341,440 |
| 2023 | $4,301 | $493,020 | $40,000 | $453,020 |
| 2022 | $3,875 | $377,120 | $40,000 | $337,120 |
| 2021 | $4,485 | $292,130 | $40,000 | $252,130 |
| 2020 | $4,529 | $297,740 | $40,000 | $257,740 |
| 2019 | $4,310 | $274,310 | $40,000 | $234,310 |
| 2018 | $3,918 | $241,020 | $40,000 | $201,020 |
| 2017 | $3,897 | $233,050 | $40,000 | $193,050 |
| 2016 | $3,798 | $227,110 | $30,000 | $197,110 |
| 2015 | $3,536 | $224,970 | $30,000 | $194,970 |
| 2014 | $3,536 | $224,970 | $30,000 | $194,970 |
Source: Public Records
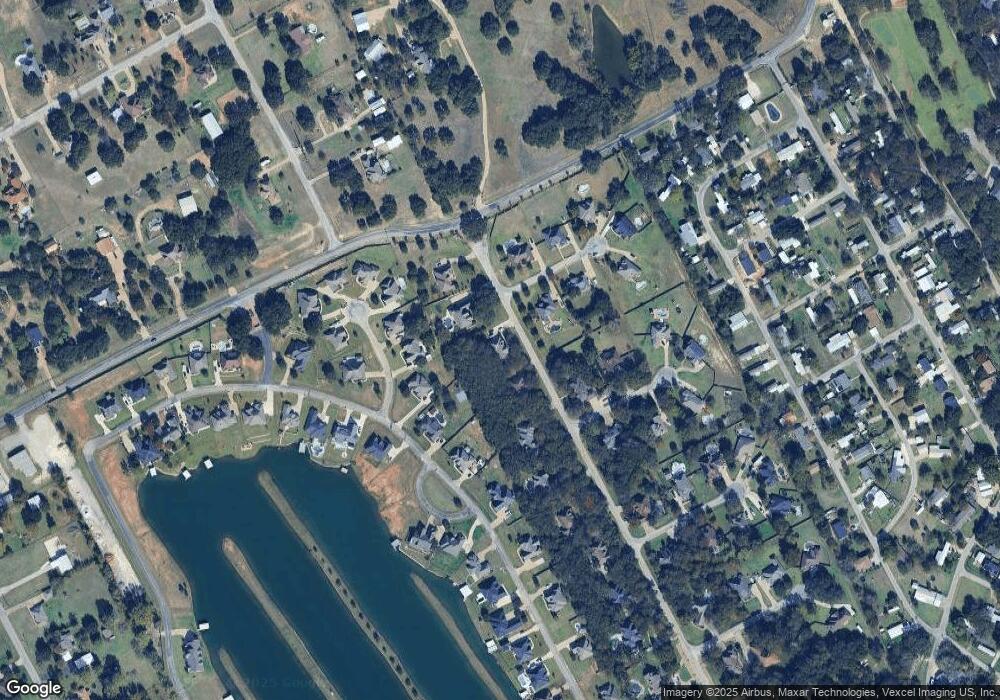
Map
Nearby Homes
- 4012 Upper Lake Cir
- 3606 Upper Lake Cir
- 3609 Upper Lake Cir
- 4312 Rhea Rd
- 3901 Upper Lake Cir
- 3207 Hummingbird Ct
- 3625 Montego Blvd
- 3620 Montgomery Dr
- 3905 Montgomery Dr
- 3119 Bob White Dr
- 3521 Nassau Ct
- 4900 Del Rio Ct
- 4504 E Kenwood Ct
- 4506 E Kenwood Ct
- Lot 189 E Kenwood Ct
- 5040 Santa Elena Ct
- 3722 Cove Timber Ave
- 5041 Santa Elena Ct
- 4505 Cove Timber Ct
- 4902 Boquillas Ct E
- 3506 Big Timber Ln
- 3502 Big Timber Ln
- 4401 Twin Oak Ct
- 4401 Shallow Creek Ct
- 4403 Twin Oak Ct
- 4013 Upper Lake Cir
- 4405 Twin Oak Ct
- 3508 Big Timber Ln
- 4400 Tall Timber Ct
- 4011 Upper Lake Cir
- 3500 Big Timber Ln
- 4407 Twin Oak Ct
- 4400 Shallow Creek Ct
- 4403 Shallow Creek Ct
- 4402 Tall Timber Ct
- 4402 Twin Oak Ct
- 3510 Big Timber Ln
- 4007 Upper Lake Cir
- 4409 Twin Oak Ct
- 4402 Shallow Creek Ct