Estimated Value: $624,000 - $700,899
5
Beds
4
Baths
2,990
Sq Ft
$220/Sq Ft
Est. Value
About This Home
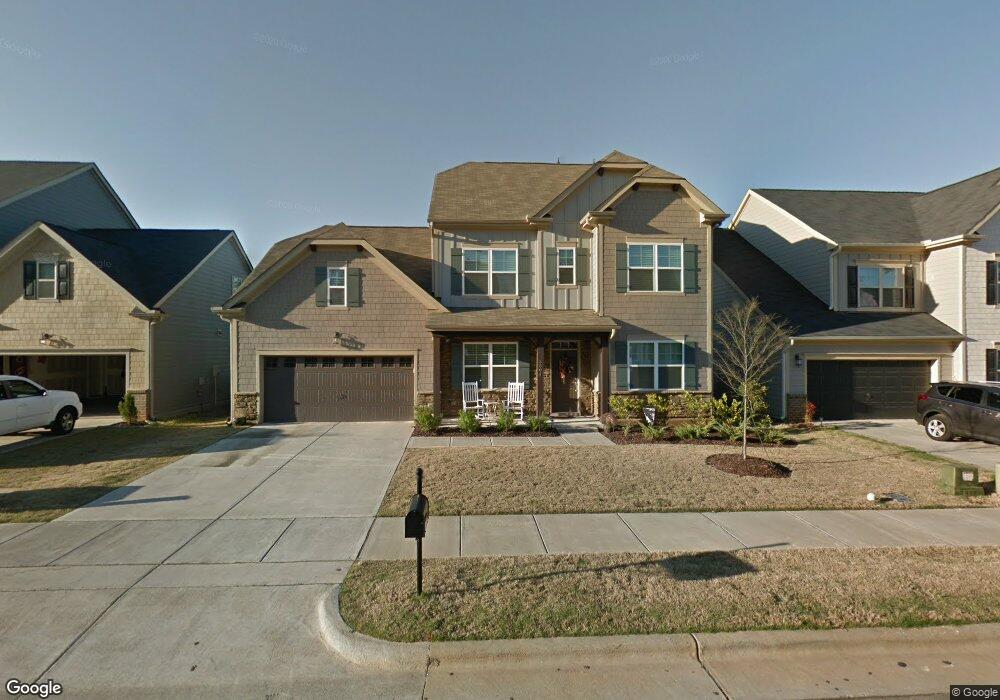
This home is located at 3504 Colby Chase Dr Unit 56, Apex, NC 27539 and is currently estimated at $658,475, approximately $220 per square foot. 3504 Colby Chase Dr Unit 56 is a home located in Wake County with nearby schools including Lufkin Road Middle School, Apex Friendship High School, and Pine Springs Prep Academy.
Ownership History
Date
Name
Owned For
Owner Type
Purchase Details
Closed on
May 23, 2019
Sold by
Queen Jason and Queen Alyssa
Bought by
Murphy April
Current Estimated Value
Home Financials for this Owner
Home Financials are based on the most recent Mortgage that was taken out on this home.
Original Mortgage
$370,500
Outstanding Balance
$325,083
Interest Rate
4.1%
Mortgage Type
New Conventional
Estimated Equity
$333,392
Purchase Details
Closed on
Oct 9, 2014
Sold by
Ashton Raleigh Residential Ll
Bought by
Queen Jason and Queen Alyssa
Home Financials for this Owner
Home Financials are based on the most recent Mortgage that was taken out on this home.
Original Mortgage
$332,500
Interest Rate
4.16%
Mortgage Type
New Conventional
Create a Home Valuation Report for This Property
The Home Valuation Report is an in-depth analysis detailing your home's value as well as a comparison with similar homes in the area
Home Values in the Area
Average Home Value in this Area
Purchase History
| Date | Buyer | Sale Price | Title Company |
|---|---|---|---|
| Murphy April | $390,000 | None Available | |
| Queen Jason | $354,000 | None Available |
Source: Public Records
Mortgage History
| Date | Status | Borrower | Loan Amount |
|---|---|---|---|
| Open | Murphy April | $370,500 | |
| Previous Owner | Queen Jason | $332,500 |
Source: Public Records
Tax History Compared to Growth
Tax History
| Year | Tax Paid | Tax Assessment Tax Assessment Total Assessment is a certain percentage of the fair market value that is determined by local assessors to be the total taxable value of land and additions on the property. | Land | Improvement |
|---|---|---|---|---|
| 2025 | $5,641 | $643,809 | $130,000 | $513,809 |
| 2024 | $5,515 | $643,809 | $130,000 | $513,809 |
| 2023 | $4,661 | $423,057 | $68,000 | $355,057 |
| 2022 | $4,375 | $423,057 | $68,000 | $355,057 |
| 2021 | $4,208 | $423,057 | $68,000 | $355,057 |
| 2020 | $4,166 | $423,057 | $68,000 | $355,057 |
| 2019 | $3,853 | $337,460 | $68,000 | $269,460 |
| 2018 | $3,629 | $337,460 | $68,000 | $269,460 |
| 2017 | $3,378 | $337,460 | $68,000 | $269,460 |
| 2016 | $3,329 | $337,460 | $68,000 | $269,460 |
| 2015 | $3,142 | $310,848 | $54,000 | $256,848 |
| 2014 | -- | $54,000 | $54,000 | $0 |
Source: Public Records
Map
Nearby Homes
- 680 Wickham Ridge Rd
- 5417 Bobbitt Rd
- 825 Wickham Ridge Rd
- 3340 Colby Chase Dr Unit Lot 2
- 3332 Colby Chase Dr Unit Lot 3
- 2340 Horton Park Dr
- 2273 Horton Park Dr
- 2271 Horton Park Dr
- 2269 Horton Park Dr
- 2267 Horton Park Dr
- 2265 Horton Park Dr
- 314 Cabana Dr
- 2325 Horton Park Dr
- 2332 Horton Park Dr
- 2253 Horton Park Dr
- 2329 Horton Park Dr
- 2341 Horton Park Dr
- 102 Spring Dove Ln
- 2218 Carcillar Dr
- 2216 Carcillar Dr
- 3504 Colby Chase Dr
- 3500 Colby Chase Dr
- 3500 Colby Chase Dr Unit 213
- 3508 Colby Chase Dr
- 2459 Baslow Dr
- 305 Dinsorette Ln
- 2457 Baslow Dr
- 2455 Baslow Dr
- 2453 Baslow Dr
- 3505 Colby Chase Dr
- 2451 Baslow Dr
- 3496 Colby Chase Dr
- 3501 Colby Chase Dr
- 3501 Colby Chase Dr Unit Lot 54
- 3501 Colby Chase Dr Unit 224
- 3509 Colby Chase Dr
- 3604 Colby Chase Dr
- 2449 Baslow Dr
- 307 Dinsorette Ln
- 2447 Baslow Dr