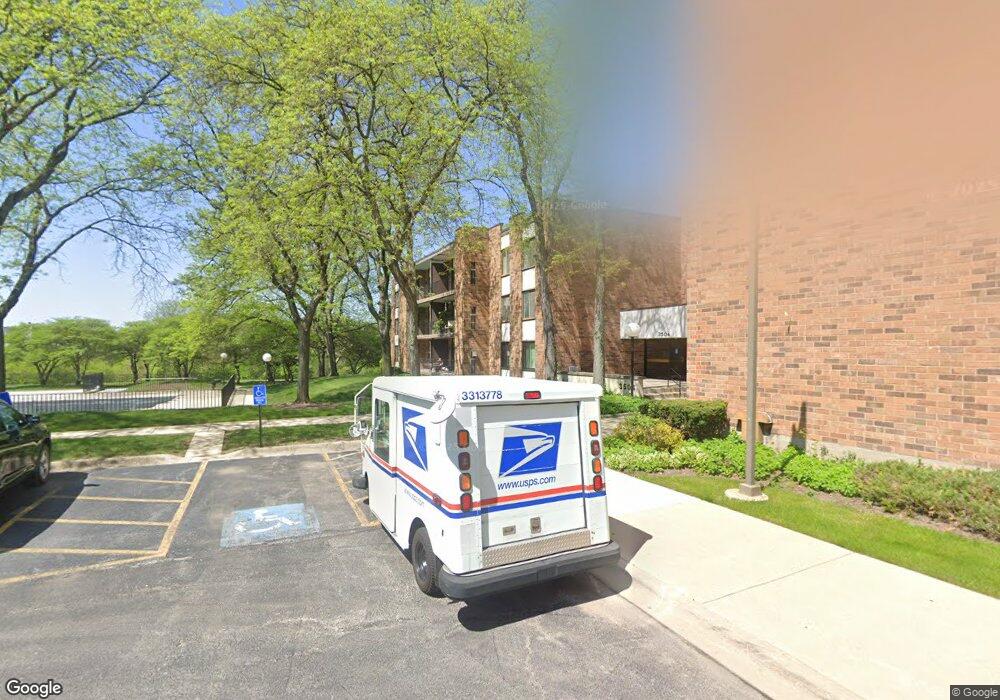
3504 Lakeview Dr Unit 3109 Hazel Crest, IL 60429
Village West NeighborhoodEstimated Value: $145,000 - $171,000
2
Beds
2
Baths
1,100
Sq Ft
$146/Sq Ft
Est. Value
About This Home
This home is located at 3504 Lakeview Dr Unit 3109, Hazel Crest, IL 60429 and is currently estimated at $160,198, approximately $145 per square foot. 3504 Lakeview Dr Unit 3109 is a home located in Cook County with nearby schools including Flossmoor Hills Elementary School, Parker Junior High School, and Homewood-Flossmoor High School.
Ownership History
Date
Name
Owned For
Owner Type
Purchase Details
Closed on
Jun 15, 2024
Sold by
Bayer Barry and Bayer Susan
Bought by
Jackson Joyce N and Williams Melvin R
Current Estimated Value
Purchase Details
Closed on
Jan 28, 2020
Sold by
Sylvia Willis and Sylvia Frank D
Bought by
Barry Bayer and Barry Susan Bayer
Purchase Details
Closed on
Mar 24, 2008
Sold by
Duncan Mitchell R and Duncan Tracy
Bought by
Willis Sylvia
Purchase Details
Closed on
Sep 26, 2006
Sold by
Neubauer Robert and Neubauer Laura E
Bought by
Duncan Mitchell R
Home Financials for this Owner
Home Financials are based on the most recent Mortgage that was taken out on this home.
Original Mortgage
$110,800
Interest Rate
6.49%
Mortgage Type
Unknown
Purchase Details
Closed on
Apr 22, 2005
Sold by
Paul William G C
Bought by
Neubauer Robert and Neubauer Laura E
Create a Home Valuation Report for This Property
The Home Valuation Report is an in-depth analysis detailing your home's value as well as a comparison with similar homes in the area
Home Values in the Area
Average Home Value in this Area
Purchase History
| Date | Buyer | Sale Price | Title Company |
|---|---|---|---|
| Jackson Joyce N | $140,000 | Fidelity National Title | |
| Barry Bayer | $72,000 | Attorney | |
| Willis Sylvia | $127,500 | Chicago Title Insurance Co | |
| Duncan Mitchell R | $138,500 | Ticor Title | |
| Neubauer Robert | $87,500 | Ticor Title |
Source: Public Records
Mortgage History
| Date | Status | Borrower | Loan Amount |
|---|---|---|---|
| Previous Owner | Duncan Mitchell R | $110,800 |
Source: Public Records
Tax History Compared to Growth
Tax History
| Year | Tax Paid | Tax Assessment Tax Assessment Total Assessment is a certain percentage of the fair market value that is determined by local assessors to be the total taxable value of land and additions on the property. | Land | Improvement |
|---|---|---|---|---|
| 2024 | $4,749 | $9,003 | $1,007 | $7,996 |
| 2023 | $3,938 | $9,003 | $1,007 | $7,996 |
| 2022 | $3,938 | $5,431 | $685 | $4,746 |
| 2021 | $3,891 | $5,429 | $684 | $4,745 |
| 2020 | $3,640 | $5,429 | $684 | $4,745 |
| 2019 | $4,020 | $5,790 | $644 | $5,146 |
| 2018 | $3,865 | $5,790 | $644 | $5,146 |
| 2017 | $3,674 | $5,790 | $644 | $5,146 |
| 2016 | $200 | $4,839 | $604 | $4,235 |
| 2015 | $207 | $4,839 | $604 | $4,235 |
| 2014 | $256 | $4,839 | $604 | $4,235 |
| 2013 | $1,432 | $8,743 | $604 | $8,139 |
Source: Public Records
Map
Nearby Homes
- 18600 Village West Dr Unit 310
- 18600 Village West Dr Unit 206
- 18208 Fountainbleau Dr
- 18623 Augusta Ln
- 3360 184th St Unit 3W
- 18638 Golfview Dr
- 3525 Marseilles Ln
- 18622 Golfview Dr
- 18108 Fountainbleau Dr
- 18650 Golfview Dr
- 3255 183rd St
- 3710 Briar Ln
- 18018 Chantilly Ln Unit S3
- 3406 Seine Ct
- 3400 Seine Ct
- 3800 River Rd
- 18106 Charlemagne Ave
- 3411 Montmarte Ave
- 18120 Versailles Ln
- 18107 Kedzie Ave
- 3504 Lakeview Dr Unit 202
- 3504 Lakeview Dr Unit 108
- 3504 Lakeview Dr Unit 309
- 3504 Lakeview Dr Unit 311
- 3504 Lakeview Dr Unit 3207
- 3504 Lakeview Dr Unit 3304
- 3504 Lakeview Dr Unit 3306
- 3504 Lakeview Dr Unit 3402
- 3504 Lakeview Dr Unit 3112
- 3504 Lakeview Dr Unit 3205
- 3504 Lakeview Dr Unit 3403
- 3504 Lakeview Dr Unit 3102
- 3504 Lakeview Dr Unit 3103
- 3504 Lakeview Dr Unit 3408
- 3504 Lakeview Dr Unit 3211
- 3504 Lakeview Dr Unit 3111
- 3504 Lakeview Dr Unit 3302
- 3504 Lakeview Dr Unit 3303
- 3504 Lakeview Dr Unit 3406
- 3504 Lakeview Dr Unit 3212