Estimated Value: $72,000 - $135,000
3
Beds
1
Bath
1,216
Sq Ft
$85/Sq Ft
Est. Value
About This Home
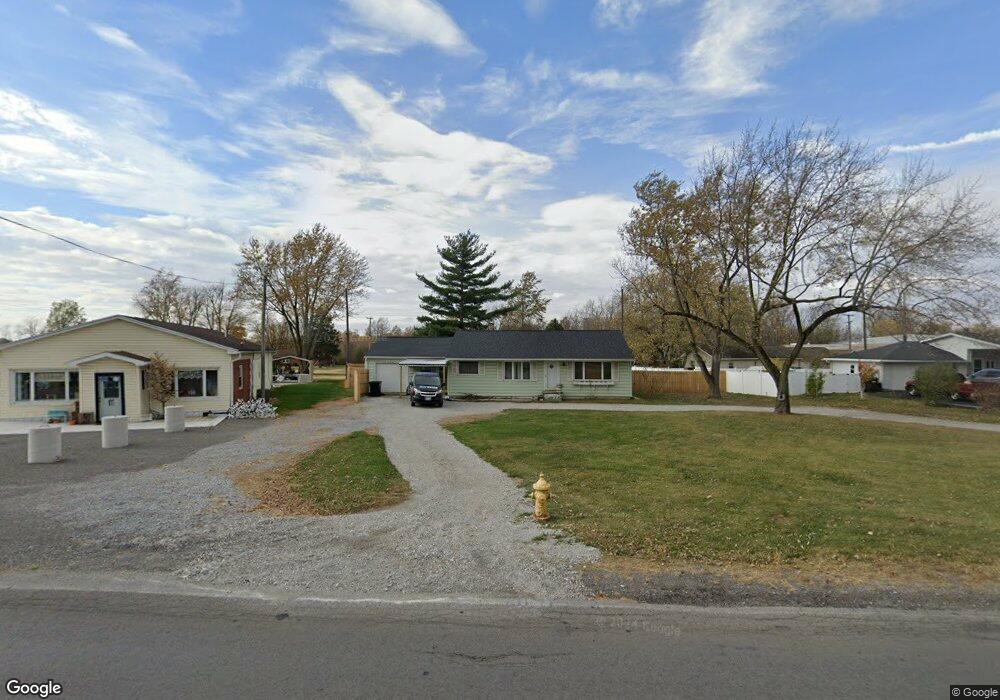
This home is located at 3504 S Dixie Hwy, Lima, OH 45804 and is currently estimated at $103,203, approximately $84 per square foot. 3504 S Dixie Hwy is a home located in Allen County with nearby schools including Elmwood Elementary School, Maplewood Elementary School, and Shawnee Middle School.
Ownership History
Date
Name
Owned For
Owner Type
Purchase Details
Closed on
Apr 16, 2021
Sold by
Fenton Judith A and Golden Sally Elizabeth
Bought by
Holten Douglas Alan
Current Estimated Value
Purchase Details
Closed on
Jul 21, 2006
Sold by
Fenton Darrell D and Fenton Judith A
Bought by
Fenton Darrell D and Fenton Judith A
Purchase Details
Closed on
May 16, 2006
Sold by
Hilyard Scott R
Bought by
Fenton Darrell D and Fenton Judith A
Home Financials for this Owner
Home Financials are based on the most recent Mortgage that was taken out on this home.
Original Mortgage
$56,700
Interest Rate
6.39%
Mortgage Type
Future Advance Clause Open End Mortgage
Purchase Details
Closed on
Oct 27, 1995
Sold by
Tenwalde Henry
Bought by
Hilyard Scott
Purchase Details
Closed on
Jan 1, 1990
Bought by
Tenwalde Henry J
Create a Home Valuation Report for This Property
The Home Valuation Report is an in-depth analysis detailing your home's value as well as a comparison with similar homes in the area
Home Values in the Area
Average Home Value in this Area
Purchase History
| Date | Buyer | Sale Price | Title Company |
|---|---|---|---|
| Holten Douglas Alan | -- | None Available | |
| Fenton Darrell D | -- | None Available | |
| Fenton Darrell D | $63,000 | None Available | |
| Hilyard Scott | $45,500 | -- | |
| Tenwalde Henry J | -- | -- |
Source: Public Records
Mortgage History
| Date | Status | Borrower | Loan Amount |
|---|---|---|---|
| Previous Owner | Fenton Darrell D | $56,700 |
Source: Public Records
Tax History Compared to Growth
Tax History
| Year | Tax Paid | Tax Assessment Tax Assessment Total Assessment is a certain percentage of the fair market value that is determined by local assessors to be the total taxable value of land and additions on the property. | Land | Improvement |
|---|---|---|---|---|
| 2024 | $1,397 | $27,410 | $7,280 | $20,130 |
| 2023 | $1,234 | $21,070 | $5,600 | $15,470 |
| 2022 | $1,226 | $21,070 | $5,600 | $15,470 |
| 2021 | $1,230 | $21,070 | $5,600 | $15,470 |
| 2020 | $942 | $18,800 | $5,390 | $13,410 |
| 2019 | $942 | $18,800 | $5,390 | $13,410 |
| 2018 | $936 | $18,800 | $5,390 | $13,410 |
| 2017 | $965 | $18,800 | $5,390 | $13,410 |
| 2016 | $954 | $18,800 | $5,390 | $13,410 |
| 2015 | $919 | $18,800 | $5,390 | $13,410 |
| 2014 | $919 | $17,920 | $5,320 | $12,600 |
| 2013 | $903 | $17,920 | $5,320 | $12,600 |
Source: Public Records
Map
Nearby Homes
- 1643 W Breese Rd Unit 73
- 1934 Jo Jean Rd
- 2530 Circle Dr
- 3780 Shawnee Rd
- 3549 Camden Place
- 137 Caribou Cir
- 2852 Riverwalk Blvd Unit 2852
- 3372 Weldon Dr
- 3346 Weldon Dr
- 3332 Weldon Dr
- 3320 Weldon Dr
- 3398 Weldon Dr
- 3358 Weldon Dr
- 3386 Weldon Dr
- 3375 Weldon Dr
- 3349 Weldon Dr
- 3337 Weldon Dr
- 3323 Weldon Dr
- 3363 Weldon Dr
- 3744 Linfield Ln