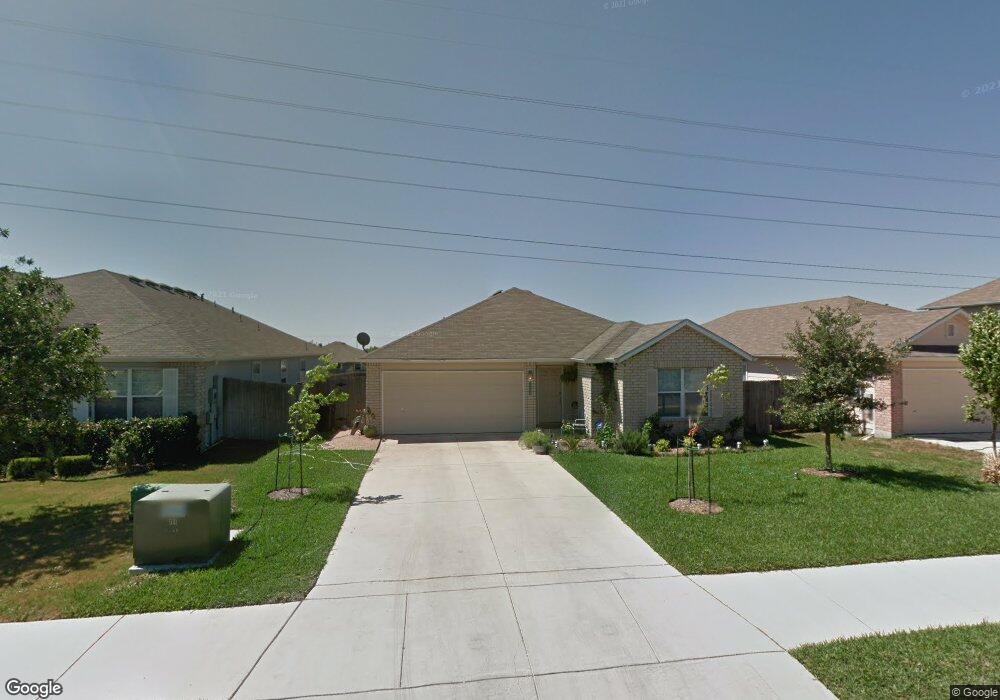
3504 Whisper Trace Cibolo, TX 78108
Estimated Value: $243,000 - $266,000
3
Beds
2
Baths
1,579
Sq Ft
$160/Sq Ft
Est. Value
About This Home
This home is located at 3504 Whisper Trace, Cibolo, TX 78108 and is currently estimated at $252,207, approximately $159 per square foot. 3504 Whisper Trace is a home located in Guadalupe County with nearby schools including John A. Sippel Elementary School, Elaine S Schlather Intermediate School, and Dobie J High School.
Ownership History
Date
Name
Owned For
Owner Type
Purchase Details
Closed on
Jan 20, 2010
Sold by
Aurora Loan Services Llc
Bought by
Brown Vicki L
Current Estimated Value
Home Financials for this Owner
Home Financials are based on the most recent Mortgage that was taken out on this home.
Original Mortgage
$118,316
Outstanding Balance
$78,855
Interest Rate
5.25%
Mortgage Type
FHA
Estimated Equity
$173,352
Purchase Details
Closed on
Nov 3, 2009
Sold by
Eberhart Daryl D and Eberhart Joyce
Bought by
Aurora Loan Services Llc
Purchase Details
Closed on
Dec 29, 2005
Sold by
Standard Pacific Of Texas Lp
Bought by
Eberhart Daryl D and Eberhart Joyce
Home Financials for this Owner
Home Financials are based on the most recent Mortgage that was taken out on this home.
Original Mortgage
$129,871
Interest Rate
6.23%
Mortgage Type
Fannie Mae Freddie Mac
Create a Home Valuation Report for This Property
The Home Valuation Report is an in-depth analysis detailing your home's value as well as a comparison with similar homes in the area
Home Values in the Area
Average Home Value in this Area
Purchase History
| Date | Buyer | Sale Price | Title Company |
|---|---|---|---|
| Brown Vicki L | -- | Lsi Title Agency Inc | |
| Aurora Loan Services Llc | $144,540 | None Available | |
| Eberhart Daryl D | -- | Stewart Title Company |
Source: Public Records
Mortgage History
| Date | Status | Borrower | Loan Amount |
|---|---|---|---|
| Open | Brown Vicki L | $118,316 | |
| Previous Owner | Eberhart Daryl D | $129,871 |
Source: Public Records
Tax History Compared to Growth
Tax History
| Year | Tax Paid | Tax Assessment Tax Assessment Total Assessment is a certain percentage of the fair market value that is determined by local assessors to be the total taxable value of land and additions on the property. | Land | Improvement |
|---|---|---|---|---|
| 2025 | $2,122 | $223,872 | $30,173 | $193,699 |
| 2024 | $2,122 | $242,984 | $37,835 | $205,149 |
| 2023 | $4,523 | $232,000 | $41,705 | $190,295 |
| 2022 | $4,755 | $219,784 | $39,000 | $208,400 |
| 2021 | $4,612 | $199,804 | $26,775 | $173,029 |
| 2020 | $4,214 | $181,927 | $20,475 | $161,452 |
| 2019 | $4,076 | $170,787 | $20,475 | $150,312 |
| 2018 | $3,981 | $168,621 | $22,050 | $146,571 |
| 2017 | $3,146 | $157,693 | $22,680 | $135,013 |
| 2016 | $3,534 | $150,644 | $22,680 | $127,964 |
| 2015 | $3,146 | $142,021 | $22,680 | $119,341 |
| 2014 | $3,177 | $143,698 | $15,750 | $127,948 |
Source: Public Records
Map
Nearby Homes
- 3941 Cherry Tree Dr
- 3325 Orth Ave
- 4004 Whisper Ridge
- 3940 Whisper Field
- 320 Asiago
- 3417 Whisper Manor
- 920 Kauri Cliffs
- 3433 Whisper Manor
- 3430 Whisper Haven
- 909 Kauri Cliffs
- 3949 Whisper Point
- 3320 Whisper Bluff
- 3302 Whisper Bluff
- 4116 Wensledale Dr
- 813 Sussex Cove
- 3436 Whisper Bluff
- 4128 Wensledale Dr
- 4116 Whisper Point
- 816 Rye Moon Cove
- 417 Landmark Falls
- 3500 Whisper Trace
- 3508 Whisper Trace
- 3414 Whisper Trace
- 3512 Whisper Trace
- 3902 Whisper View
- 3901 Whisper Ridge
- 3410 Whisper Trace
- 3906 Whisper View
- 3905 Whisper Ridge
- 3905 Whisper Ridge
- 3419 Whisper Branch
- 3406 Whisper Trace
- 3600 Whisper Trace
- 3415 Whisper Branch
- 3423 Whisper Branch
- 3411 Whisper Branch
- 3427 Whisper Branch
- 3910 Whisper View
- 3909 Whisper Ridge
- 3604 Whisper Trace