Estimated Value: $262,000 - $294,000
--
Bed
2
Baths
1,667
Sq Ft
$162/Sq Ft
Est. Value
About This Home
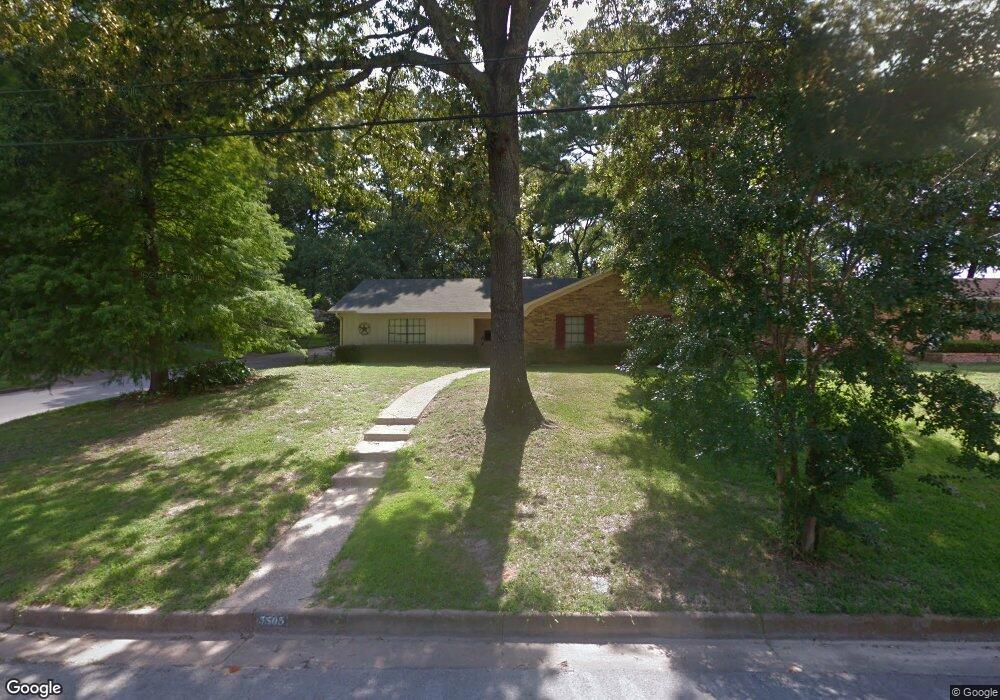
This home is located at 3505 3505 Cloverdale, Tyler, TX 75701 and is currently estimated at $270,349, approximately $162 per square foot. 3505 3505 Cloverdale is a home located in Smith County with nearby schools including Woods Elementary School, Hubbard Middle School, and Tyler Legacy High School.
Ownership History
Date
Name
Owned For
Owner Type
Purchase Details
Closed on
Mar 6, 2015
Sold by
Northcutt Rendall and Northcutt Stacey
Bought by
Machiavello Joshua David
Current Estimated Value
Home Financials for this Owner
Home Financials are based on the most recent Mortgage that was taken out on this home.
Original Mortgage
$108,000
Outstanding Balance
$37,483
Interest Rate
3.66%
Mortgage Type
New Conventional
Estimated Equity
$232,866
Purchase Details
Closed on
Sep 10, 2010
Sold by
Perry Laura Anne
Bought by
Northcutt Rendall
Home Financials for this Owner
Home Financials are based on the most recent Mortgage that was taken out on this home.
Original Mortgage
$129,857
Interest Rate
4.5%
Mortgage Type
FHA
Create a Home Valuation Report for This Property
The Home Valuation Report is an in-depth analysis detailing your home's value as well as a comparison with similar homes in the area
Home Values in the Area
Average Home Value in this Area
Purchase History
| Date | Buyer | Sale Price | Title Company |
|---|---|---|---|
| Machiavello Joshua David | -- | None Available | |
| Northcutt Rendall | -- | Htc |
Source: Public Records
Mortgage History
| Date | Status | Borrower | Loan Amount |
|---|---|---|---|
| Open | Machiavello Joshua David | $108,000 | |
| Previous Owner | Northcutt Rendall | $129,857 |
Source: Public Records
Tax History Compared to Growth
Tax History
| Year | Tax Paid | Tax Assessment Tax Assessment Total Assessment is a certain percentage of the fair market value that is determined by local assessors to be the total taxable value of land and additions on the property. | Land | Improvement |
|---|---|---|---|---|
| 2025 | $3,226 | $277,644 | $71,785 | $205,859 |
| 2024 | $3,226 | $246,610 | $24,238 | $222,372 |
| 2023 | $4,008 | $241,277 | $24,238 | $217,039 |
| 2022 | $4,095 | $230,287 | $24,238 | $206,049 |
| 2021 | $3,986 | $190,009 | $13,850 | $176,159 |
| 2020 | $4,016 | $187,660 | $13,850 | $173,810 |
| 2019 | $3,847 | $175,935 | $13,850 | $162,085 |
| 2018 | $3,788 | $174,152 | $13,850 | $160,302 |
| 2017 | $3,626 | $174,152 | $13,850 | $160,302 |
| 2016 | $3,296 | $154,402 | $13,850 | $140,552 |
| 2015 | $2,910 | $152,917 | $13,850 | $139,067 |
| 2014 | $2,910 | $148,180 | $13,850 | $134,330 |
Source: Public Records
Map
Nearby Homes
- 3505 Cloverdale Dr
- 3518 Cloverdale Dr
- 3501 Silverwood Dr
- 3500 Silverwood Dr
- 3425 Iberville Dr
- 3404 Silverwood Dr
- 3426 Bienville Dr
- 3413 Iberville Dr
- 3606 Glendale Dr
- 815 Woodland Hills Dr
- 1317 Woodland Hills Dr
- 3829 Cloverdale Dr
- 3915 Post Oak Rd
- 3324 Teakwood Dr
- 701 Woodland Hills Dr
- 612 Rosemont Place II
- 1531 Woodland Hills Dr
- 1111 Beechwood Dr
- 3048 Concord Place
- 4001 Darrell Ln
- 3501 Cloverdale Dr
- 1207 Hampton Ln
- 3515 Cloverdale Dr
- 3433 Cloverdale Dr
- 3506 Cloverdale Dr
- 1206 Hampton Ln
- 3512 Cloverdale Dr
- 1213 Hampton Ln
- 3444 Cottage Ct
- 3500 Cloverdale Dr
- 3448 Cottage Ct
- 1212 Hampton Ln
- 3427 Cloverdale Dr
- 3427 3427 Cloverdale
- 3507 Silverwood Dr
- 3601 Cloverdale Dr
- 3440 Iberville Dr
- 3513 Silverwood Dr
- 3601 3601 Cloverdale
- 3440 3440 Iberville Dr