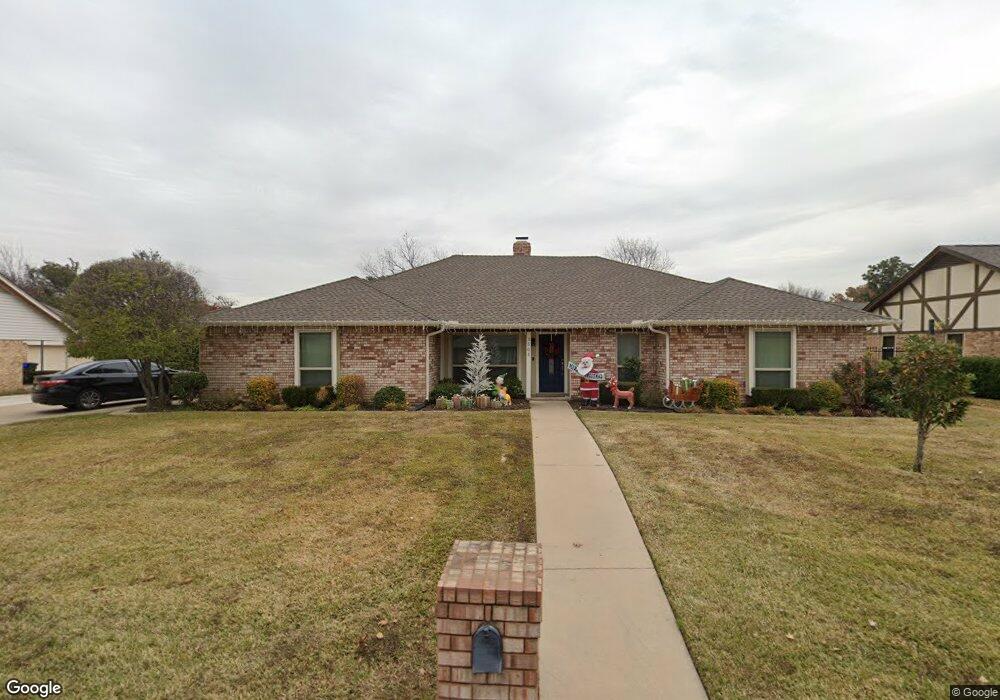
3505 Blue Quail Ln Colleyville, TX 76034
Estimated Value: $516,061 - $618,000
4
Beds
3
Baths
2,368
Sq Ft
$246/Sq Ft
Est. Value
About This Home
This home is located at 3505 Blue Quail Ln, Colleyville, TX 76034 and is currently estimated at $582,515, approximately $245 per square foot. 3505 Blue Quail Ln is a home located in Tarrant County with nearby schools including Bedford Heights Elementary School, Bedford Junior High School, and L.D. Bell High School.
Ownership History
Date
Name
Owned For
Owner Type
Purchase Details
Closed on
Mar 27, 2024
Sold by
Cullen Leslie Nicole
Bought by
Cullen John Bradford
Current Estimated Value
Purchase Details
Closed on
Sep 17, 2015
Sold by
Cullen John
Bought by
Cullen Lesile N
Purchase Details
Closed on
Oct 22, 2010
Sold by
Hanna Ronald L and Hanna Melissa L
Bought by
Cullen John
Home Financials for this Owner
Home Financials are based on the most recent Mortgage that was taken out on this home.
Original Mortgage
$160,000
Interest Rate
4.41%
Mortgage Type
New Conventional
Purchase Details
Closed on
May 7, 2009
Sold by
Ayars H Bruce and Ayars Miriam L
Bought by
Hanna Ronald L and Hanna Melissa L
Home Financials for this Owner
Home Financials are based on the most recent Mortgage that was taken out on this home.
Original Mortgage
$100,000
Interest Rate
4.84%
Mortgage Type
Purchase Money Mortgage
Create a Home Valuation Report for This Property
The Home Valuation Report is an in-depth analysis detailing your home's value as well as a comparison with similar homes in the area
Home Values in the Area
Average Home Value in this Area
Purchase History
| Date | Buyer | Sale Price | Title Company |
|---|---|---|---|
| Cullen John Bradford | -- | None Listed On Document | |
| Cullen Lesile N | -- | Fnt | |
| Cullen John | -- | Hexter Fair Title Company | |
| Hanna Ronald L | -- | Hftc |
Source: Public Records
Mortgage History
| Date | Status | Borrower | Loan Amount |
|---|---|---|---|
| Previous Owner | Cullen John | $160,000 | |
| Previous Owner | Hanna Ronald L | $100,000 |
Source: Public Records
Tax History Compared to Growth
Tax History
| Year | Tax Paid | Tax Assessment Tax Assessment Total Assessment is a certain percentage of the fair market value that is determined by local assessors to be the total taxable value of land and additions on the property. | Land | Improvement |
|---|---|---|---|---|
| 2025 | $5,165 | $383,929 | $100,000 | $283,929 |
| 2024 | $5,165 | $430,000 | $100,000 | $330,000 |
| 2023 | $6,283 | $449,000 | $75,000 | $374,000 |
| 2022 | $6,631 | $359,680 | $75,000 | $284,680 |
| 2021 | $6,451 | $308,499 | $75,000 | $233,499 |
| 2020 | $6,526 | $308,499 | $75,000 | $233,499 |
| 2019 | $6,291 | $304,419 | $75,000 | $229,419 |
| 2018 | $4,499 | $261,342 | $75,000 | $186,342 |
| 2017 | $5,421 | $263,328 | $45,000 | $218,328 |
| 2016 | $4,928 | $253,845 | $45,000 | $208,845 |
| 2015 | $4,383 | $196,350 | $26,000 | $170,350 |
| 2014 | $4,383 | $196,350 | $26,000 | $170,350 |
Source: Public Records
Map
Nearby Homes
- 305 Warbler Dr
- 405 Woodbriar Ct
- 320 Blue Quail Ct
- 3713 Brentwood Ct
- 3605 Spring Valley Dr
- 628 Huntwich Dr
- 3213 Spring Valley Dr
- 2620 Brookridge Dr
- 404 Heather Ln
- 909 Brestol Ct W
- 3609 Wayne Ct
- 3119 Spring Grove Dr
- 3624 Wayne Ct
- 432 Sunnybrook Ct
- 913 Kensington Ct
- 2732 Woodbridge Dr
- 2212 Mountainview Dr
- 2244 Hurstview Dr
- 2212 Hurstview Dr
- 801 Shady Creek Ln
- 3501 Blue Quail Ln
- 3509 Blue Quail Ln
- 3504 Meadowlark Ln
- 3500 Meadowlark Ln
- 3508 Meadowlark Ln
- 3513 Blue Quail Ln
- 3504 Blue Quail Ln
- 3500 Blue Quail Ln
- 3508 Blue Quail Ln
- 301 Quail Crest Dr
- 3512 Meadowlark Ln
- 3512 Blue Quail Ln
- 3417 Blue Quail Ln
- 303 Quail Crest Dr
- 3517 Blue Quail Ln
- 305 Quail Crest Dr
- 3516 Meadowlark Ln
- 3413 Blue Quail Ln
- 3408 Blue Quail Ln
- 3516 Blue Quail Ln