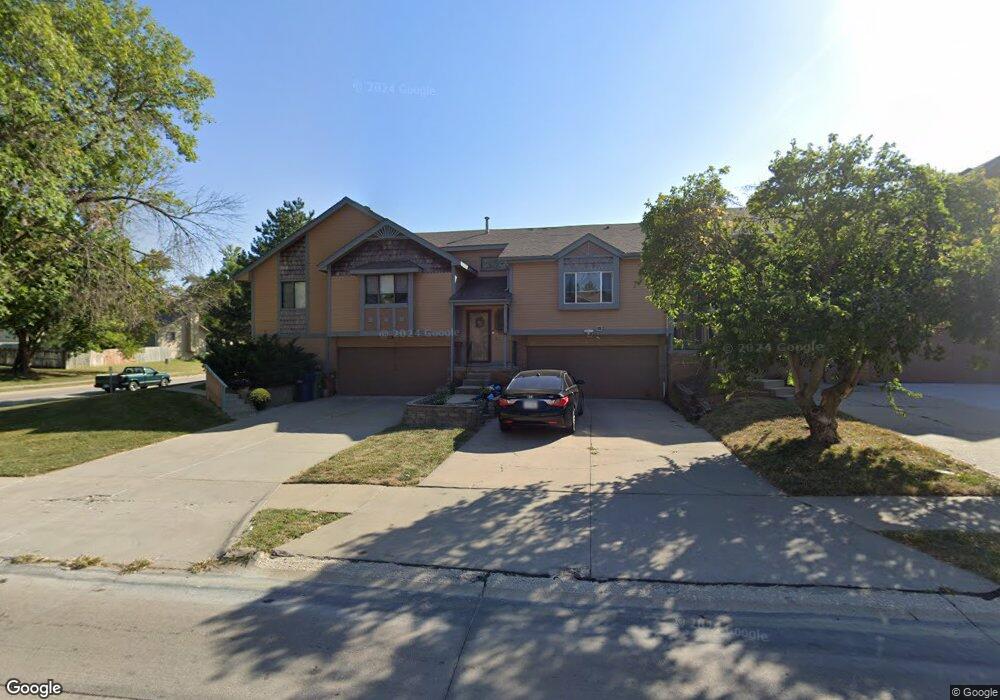
3505 Comstock Ave Bellevue, NE 68123
Estimated Value: $201,000 - $222,000
3
Beds
3
Baths
946
Sq Ft
$224/Sq Ft
Est. Value
About This Home
This home is located at 3505 Comstock Ave, Bellevue, NE 68123 and is currently estimated at $212,372, approximately $224 per square foot. 3505 Comstock Ave is a home located in Sarpy County with nearby schools including Golden Hills Elementary School, Papillion Middle School, and Papillion La Vista South High School.
Ownership History
Date
Name
Owned For
Owner Type
Purchase Details
Closed on
Dec 12, 2002
Sold by
Hud
Bought by
Yeager Mark P
Current Estimated Value
Home Financials for this Owner
Home Financials are based on the most recent Mortgage that was taken out on this home.
Original Mortgage
$98,201
Outstanding Balance
$41,118
Interest Rate
5.89%
Mortgage Type
FHA
Estimated Equity
$171,254
Purchase Details
Closed on
Jun 20, 2002
Sold by
Countrywide Home Loans Inc
Bought by
Hud
Purchase Details
Closed on
Sep 28, 2000
Sold by
Bruch Joseph M and Bruch Frank F
Bought by
Lencki Kathleen L
Home Financials for this Owner
Home Financials are based on the most recent Mortgage that was taken out on this home.
Original Mortgage
$93,426
Interest Rate
7.99%
Purchase Details
Closed on
Jan 20, 1998
Sold by
Bruch Frank F
Bought by
Bruch Joseph M and Bruch Frank F
Create a Home Valuation Report for This Property
The Home Valuation Report is an in-depth analysis detailing your home's value as well as a comparison with similar homes in the area
Home Values in the Area
Average Home Value in this Area
Purchase History
| Date | Buyer | Sale Price | Title Company |
|---|---|---|---|
| Yeager Mark P | -- | Suburban Title & Escrow | |
| Hud | -- | -- | |
| Countrywide Home Loans Inc | $100,905 | -- | |
| Lencki Kathleen L | -- | -- | |
| Lencki Kathleen L | $94,000 | -- | |
| Bruch Joseph M | -- | -- |
Source: Public Records
Mortgage History
| Date | Status | Borrower | Loan Amount |
|---|---|---|---|
| Open | Yeager Mark P | $98,201 | |
| Previous Owner | Lencki Kathleen L | $93,426 |
Source: Public Records
Tax History Compared to Growth
Tax History
| Year | Tax Paid | Tax Assessment Tax Assessment Total Assessment is a certain percentage of the fair market value that is determined by local assessors to be the total taxable value of land and additions on the property. | Land | Improvement |
|---|---|---|---|---|
| 2025 | $3,115 | $182,680 | $29,000 | $153,680 |
| 2024 | $3,729 | $181,498 | $29,000 | $152,498 |
| 2023 | $3,729 | $178,276 | $28,000 | $150,276 |
| 2022 | $3,327 | $150,111 | $25,000 | $125,111 |
| 2021 | $3,112 | $138,383 | $23,000 | $115,383 |
| 2020 | $2,878 | $127,245 | $23,000 | $104,245 |
| 2019 | $2,622 | $116,040 | $17,000 | $99,040 |
| 2018 | $2,642 | $115,262 | $17,000 | $98,262 |
| 2017 | $2,600 | $113,476 | $17,000 | $96,476 |
| 2016 | $2,488 | $108,760 | $17,000 | $91,760 |
| 2015 | $2,489 | $109,063 | $17,000 | $92,063 |
| 2014 | $2,434 | $105,998 | $17,000 | $88,998 |
| 2012 | -- | $102,905 | $17,000 | $85,905 |
Source: Public Records
Map
Nearby Homes
- 3218 Coffey Ave
- 3115 Duane Ave
- 3009 Duane Ave
- 3405 Castile Dr
- 11809 Quail Dr
- 4217 Longview St
- 4305 Barksdale Dr
- 11406 S 43rd St
- 4407 Amos Gates Dr
- 4210 Barksdale Cir
- 4320 Longview St
- 2514 Jack Pine St
- 4223 Barksdale Cir
- 4406 Barksdale Dr
- 4614 Windcrest Dr
- 12013 Daniell Rd
- 12110 Quail Dr
- 12017 Daniell Rd
- 4510 Barksdale Dr
- 12029 Daniell Rd
- 3505 Comstock
- 3507 Comstock Ave
- 3503 Comstock Ave
- 3509 Comstock Ave
- 3509 Comstock Ave
- 3512 Comstock Dr
- 3506 W Dutchman Cir
- 3511 Comstock Ave
- 3502 W Dutchman Cir
- 3513 Comstock Ave
- 3510 W Dutchman Cir
- 3427 Comstock Ave
- 3504 Comstock Ave
- 3427 Comstock Ave
- 3506 Comstock Ave
- 3508 Comstock Ave
- 3514 W Dutchman Cir
- 3430 Comstock Ave
- 3510 Comstock Ave
- 3517 Comstock Ave