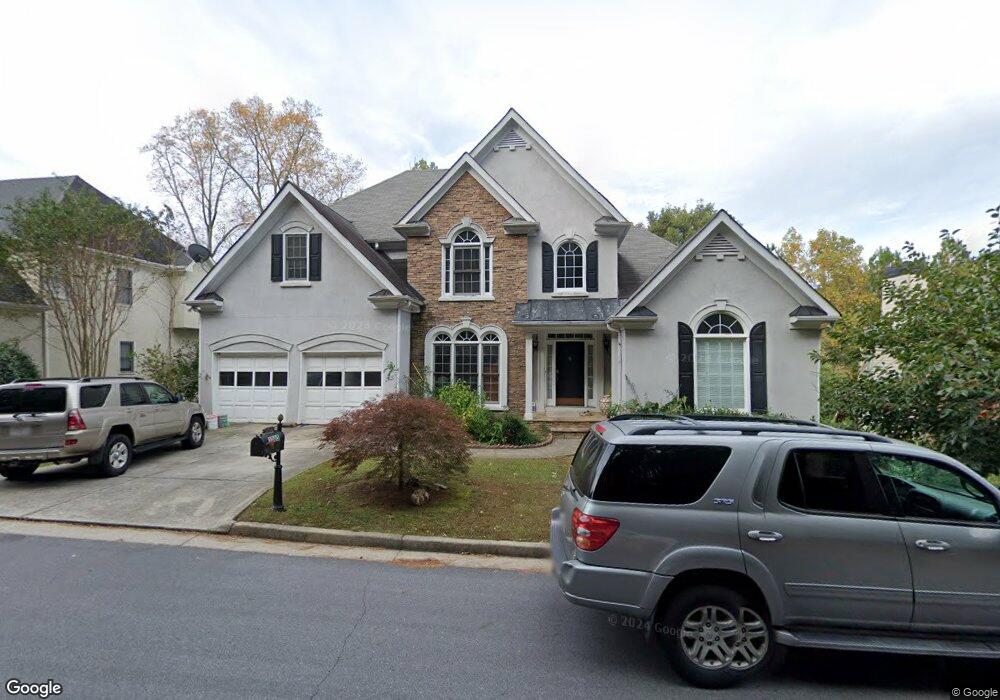
3505 Merganser Ln Unit 2 Alpharetta, GA 30022
Newtown NeighborhoodEstimated Value: $768,000 - $835,000
4
Beds
4
Baths
3,598
Sq Ft
$224/Sq Ft
Est. Value
About This Home
This home is located at 3505 Merganser Ln Unit 2, Alpharetta, GA 30022 and is currently estimated at $806,598, approximately $224 per square foot. 3505 Merganser Ln Unit 2 is a home located in Fulton County with nearby schools including Barnwell Elementary School, Haynes Bridge Middle School, and Centennial High School.
Ownership History
Date
Name
Owned For
Owner Type
Purchase Details
Closed on
Apr 10, 2023
Sold by
Yi Chong
Bought by
Yi Chris Hyoung and Yi Chong
Current Estimated Value
Purchase Details
Closed on
Jul 18, 2006
Sold by
Yi Sang H
Bought by
Yi Chong M
Home Financials for this Owner
Home Financials are based on the most recent Mortgage that was taken out on this home.
Original Mortgage
$312,000
Interest Rate
6.46%
Mortgage Type
New Conventional
Purchase Details
Closed on
Apr 21, 2000
Sold by
Pigott Geoffrey C and Pigott Carol S
Bought by
Yi Sang Ho
Home Financials for this Owner
Home Financials are based on the most recent Mortgage that was taken out on this home.
Original Mortgage
$200,000
Interest Rate
8.24%
Mortgage Type
New Conventional
Purchase Details
Closed on
Oct 25, 1996
Sold by
Peachland Homes Inc
Bought by
Pigott Geoffrey C Carol
Create a Home Valuation Report for This Property
The Home Valuation Report is an in-depth analysis detailing your home's value as well as a comparison with similar homes in the area
Home Values in the Area
Average Home Value in this Area
Purchase History
| Date | Buyer | Sale Price | Title Company |
|---|---|---|---|
| Yi Chris Hyoung | -- | -- | |
| Yi Chong M | $390,000 | -- | |
| Yi Sang Ho | $264,000 | -- | |
| Pigott Geoffrey C Carol | $169,000 | -- |
Source: Public Records
Mortgage History
| Date | Status | Borrower | Loan Amount |
|---|---|---|---|
| Previous Owner | Yi Chong M | $312,000 | |
| Previous Owner | Yi Sang Ho | $200,000 | |
| Closed | Pigott Geoffrey C Carol | $0 |
Source: Public Records
Tax History Compared to Growth
Tax History
| Year | Tax Paid | Tax Assessment Tax Assessment Total Assessment is a certain percentage of the fair market value that is determined by local assessors to be the total taxable value of land and additions on the property. | Land | Improvement |
|---|---|---|---|---|
| 2025 | $8,623 | $239,320 | $52,320 | $187,000 |
| 2023 | $5,086 | $180,200 | $37,400 | $142,800 |
| 2022 | $5,530 | $180,200 | $37,400 | $142,800 |
| 2021 | $5,899 | $187,240 | $41,320 | $145,920 |
| 2020 | $6,000 | $186,400 | $32,800 | $153,600 |
| 2019 | $722 | $183,120 | $32,240 | $150,880 |
| 2018 | $5,824 | $178,840 | $31,480 | $147,360 |
| 2017 | $5,278 | $155,080 | $33,520 | $121,560 |
| 2016 | $5,202 | $155,080 | $33,520 | $121,560 |
| 2015 | $5,260 | $155,080 | $33,520 | $121,560 |
| 2014 | $4,692 | $133,040 | $28,760 | $104,280 |
Source: Public Records
Map
Nearby Homes
- 3535 Merganser Ln Unit 2
- 3450 Merganser Ln
- 9510 Stoney Ridge Ln
- 375 N Peak Dr
- 9675 Almaviva Dr
- 150 Stoney Ridge Dr
- 352 N Peak Dr
- 9695 Almaviva Dr
- 835 Kings Arms Way
- 9715 Almaviva Dr
- 340 Mount Mitchell Way
- 545 Oak Bridge Trail
- 9320 Brumbelow Crossing Way
- 515 Oak Bridge Trail
- 235 Stoney Ridge Dr
- 8870 Old Southwick Pass
- 1050 Bedford Gardens Dr
- 595 Oak Alley Way
- 615 S Preston Ct
- 3515 Merganser Ln
- 3495 Merganser Ln
- 3525 Merganser Ln
- 9430 Stoney Ridge Ln
- 3485 Merganser Ln Unit 2
- 9420 Stoney Ridge Ln
- 3520 Merganser Ln Unit 2
- 3245 Merganser Ln
- 3245 Merganser Ln Unit 1
- 815 Harlequin Ct
- 3475 Merganser Ln
- 9450 Stoney Ridge Ln Unit 2
- 9410 Stoney Ridge Ln Unit II
- 3510 Merganser Ln
- 3555 Merganser Ln Unit 2
- 3545 Merganser Ln
- 9460 Stoney Ridge Ln
- 3235 Merganser Ln
- 805 Harlequin Ct Unit 1
- 3465 Merganser Ln Unit 2