Estimated Value: $1,443,000 - $1,740,000
4
Beds
4
Baths
4,875
Sq Ft
$318/Sq Ft
Est. Value
About This Home
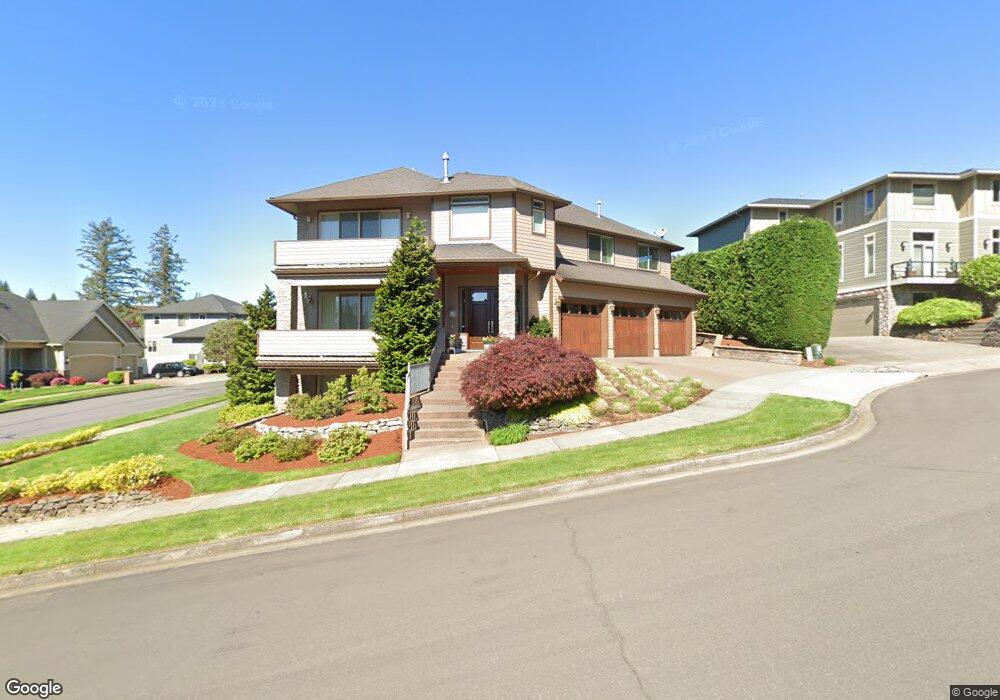
This home is located at 3505 NW Logan Ct, Camas, WA 98607 and is currently estimated at $1,551,299, approximately $318 per square foot. 3505 NW Logan Ct is a home located in Clark County with nearby schools including Helen Baller Elementary School, Liberty Middle School, and Camas High School.
Ownership History
Date
Name
Owned For
Owner Type
Purchase Details
Closed on
Jun 24, 2016
Sold by
Dierking Nathan A and Dierking Lindsey M
Bought by
Graves Robert S and Graves Randy K
Current Estimated Value
Home Financials for this Owner
Home Financials are based on the most recent Mortgage that was taken out on this home.
Original Mortgage
$275,000
Outstanding Balance
$218,869
Interest Rate
3.57%
Mortgage Type
New Conventional
Estimated Equity
$1,332,430
Purchase Details
Closed on
Aug 29, 2006
Sold by
Logan Dana
Bought by
Dierking Nathan A and Dierking Lindsey M
Home Financials for this Owner
Home Financials are based on the most recent Mortgage that was taken out on this home.
Original Mortgage
$221,000
Interest Rate
6.76%
Mortgage Type
Purchase Money Mortgage
Purchase Details
Closed on
Jul 25, 2005
Sold by
Ralston Tim R
Bought by
Logan Dana
Purchase Details
Closed on
Jul 14, 2005
Sold by
Mccaskil Mark
Bought by
Logan Dana
Create a Home Valuation Report for This Property
The Home Valuation Report is an in-depth analysis detailing your home's value as well as a comparison with similar homes in the area
Home Values in the Area
Average Home Value in this Area
Purchase History
| Date | Buyer | Sale Price | Title Company |
|---|---|---|---|
| Graves Robert S | $900,000 | Chicago Title Insurance | |
| Dierking Nathan A | $245,000 | Fidelity National Title | |
| Logan Dana | $165,000 | Chicago Title Insurance | |
| Logan Dana | -- | Chicago Title Insurance |
Source: Public Records
Mortgage History
| Date | Status | Borrower | Loan Amount |
|---|---|---|---|
| Open | Graves Robert S | $275,000 | |
| Previous Owner | Dierking Nathan A | $221,000 |
Source: Public Records
Tax History Compared to Growth
Tax History
| Year | Tax Paid | Tax Assessment Tax Assessment Total Assessment is a certain percentage of the fair market value that is determined by local assessors to be the total taxable value of land and additions on the property. | Land | Improvement |
|---|---|---|---|---|
| 2025 | $12,044 | $1,305,046 | $210,000 | $1,095,046 |
| 2024 | $12,127 | $1,264,253 | $282,000 | $982,253 |
| 2023 | $11,653 | $1,369,115 | $271,200 | $1,097,915 |
| 2022 | $11,133 | $1,250,821 | $264,972 | $985,849 |
| 2021 | $11,304 | $998,797 | $213,600 | $785,197 |
| 2020 | $12,106 | $939,727 | $210,000 | $729,727 |
| 2019 | $10,713 | $933,199 | $210,000 | $723,199 |
| 2018 | $12,652 | $879,649 | $0 | $0 |
| 2017 | $11,271 | $873,240 | $0 | $0 |
| 2016 | $10,319 | $847,228 | $0 | $0 |
| 2015 | $10,470 | $771,821 | $0 | $0 |
| 2014 | -- | $738,364 | $0 | $0 |
| 2013 | -- | $680,793 | $0 | $0 |
Source: Public Records
Map
Nearby Homes
- 1610 NW 34th Ave
- 1402 NW 30th Ave
- 3313 NW Sierra Dr
- 2112 NW 42nd Ave
- 3015 NW Vanguard Place
- 1146 NW 23rd Ave Unit A1
- 0 Parklands Lot (East) Unit NWM2403716
- 0 NW Parkland Lot (Middle) Unit NWM2403721
- 0 NW Parklands Lot (West) Unit NWM2403728
- 2160 NW Fargo Loop
- 2316 NW 26th Ave
- 2149 NW Fargo Loop
- 2120 NW Fargo Loop
- 4030 NW Dahlia Dr
- 4000 NW Dahlia Dr
- 737 NW 20th Ave
- 2052 NW Fargo Loop
- 2711 NW 28th Cir
- 4859 N Elk Dr Unit lot 7
- 2609 NW Cascade St
- 3510 NW Logan Ct
- 3508 NW Logan Ct
- 1304 NW 35th Ave
- 3511 NW Logan Ct
- 1310 NW 35th Ave
- 1216 NW 35th Ave
- 3512 NW Logan Ct
- 1318 NW 35th Ave
- 1207 NW 35th Ave
- 1208 NW 35th Ave
- 3516 NW Logan Ct
- 3518 NW Maple St
- 3513 NW Logan Ct
- 1200 NW 35th Ave
- 3530 NW Maple St
- 1135 NW 35th Ave
- 3425 NW Maple St
- 1157 NW 35th Ave
- 3507 NW Maple St